
FIGURE 7
- ID
- ZDB-IMAGE-230127-3
- Publication
- Bota et al., 2023 - Dand5 is involved in zebrafish tailbud cell movement
- All Figures
- Figures for Bota et al., 2023
|
FIGURE 7
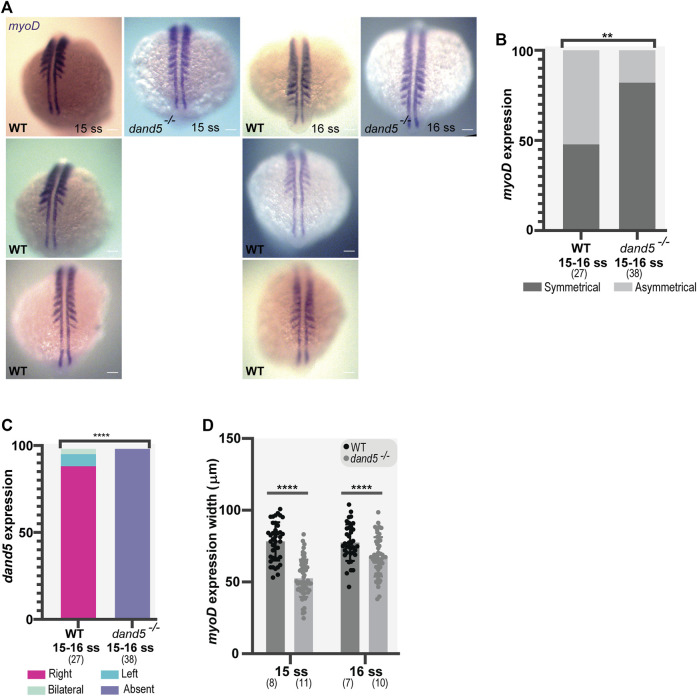
Whole-mount in situ hybridization for myoD and dand5 expression. (A,B) myoD expression and side scoring. (C) Quantification of differences in dand5 expression patterns in WT vs dand5 homozygous mutants. The chi-squared test was used for statistical analysis. (D) Quantification of myoD width in WT and dand5 −/− at 15 and 16 ss embryos. t-test unpaired comparison. Bars represent mean values, and dots represent individual embryos. * corresponds to a p-value <0 05; ** to a p-value <0.005; *** to a p-value <0.0005 and **** to a p-value <0.00005. Scale bar = 100 µm. The top is anterior, and the bottom is posterior. N is shown in parentheses.