
FIGURE 1
- ID
- ZDB-IMAGE-230127-2
- Publication
- Bota et al., 2023 - Dand5 is involved in zebrafish tailbud cell movement
- All Figures
- Figures for Bota et al., 2023
|
FIGURE 1
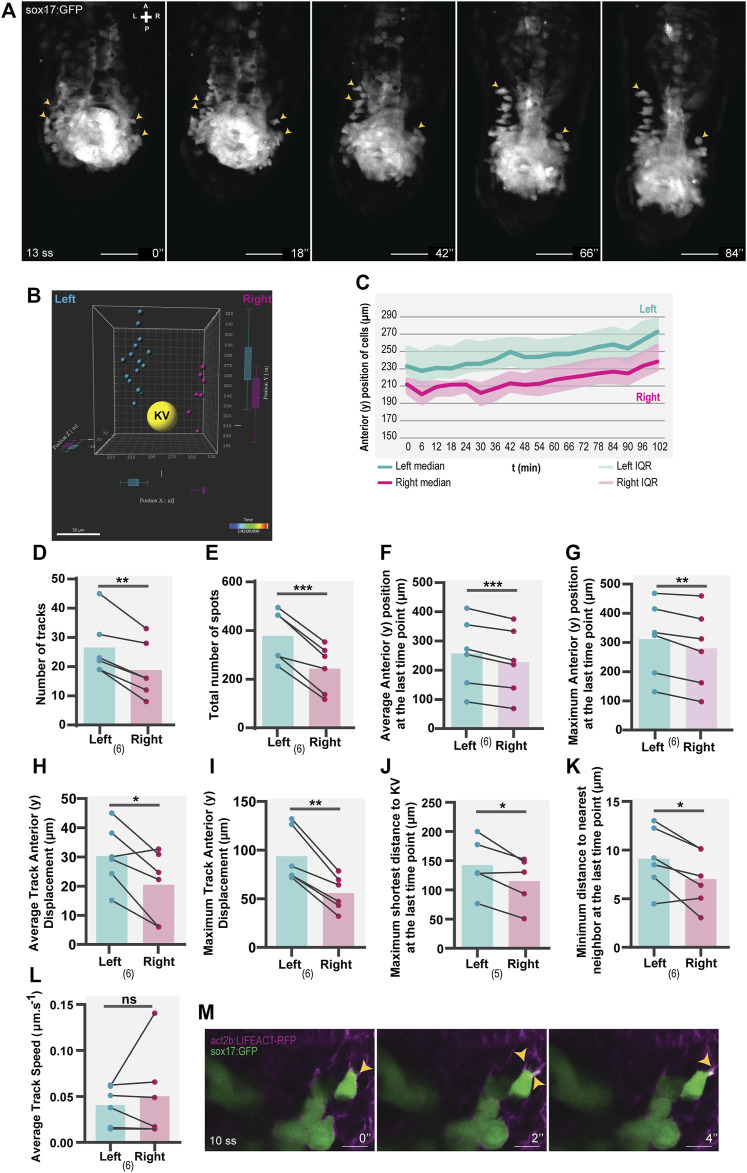
Asymmetric patterns of NKSTCs in WT embryos. (A) Time-lapse images of selected time points of a Tg(sox17:GFP) embryo starting at 13 ss and ending at 18 ss. Yellow arrowheads indicate the more anterior positions on the left and right sides. The elapsed time is indicated in minutes (‘) at the bottom-right. Scale bar = 50 µm. (B) 3D distribution of manually tracked cells at the last time-point imaged. Left spots are shown in cyan, right in magenta, and the KV lumen in yellow. (C) Dynamics of the anterior positions at consecutive time points on the left (cyan) and right (magenta) sides. The thick lines represent the medians. (D–L) Left vs right parameters extracted from cell tracking data, cyan represents the left side, and magenta represents the right side. t-test paired comparisons and IQR means interquartile range. Bars represent mean values and dots represent individual embryos. *corresponds to a p-value <0.05; ** to a p-value <0.005 and *** to a p-value <0.0005. (M) Lamellipodium-like (yellow arrowheads) structures in NKSTCs observed in Tg(act2b:LIFEACT-RFP);Tg(sox17:GFP). Scale bar = 10 µm. Axes indicate A, anterior; P, posterior; L, left; R, right. N is shown in parentheses.