
FIGURE 2
- ID
- ZDB-IMAGE-230127-1
- Publication
- Bota et al., 2023 - Dand5 is involved in zebrafish tailbud cell movement
- All Figures
- Figures for Bota et al., 2023
|
FIGURE 2
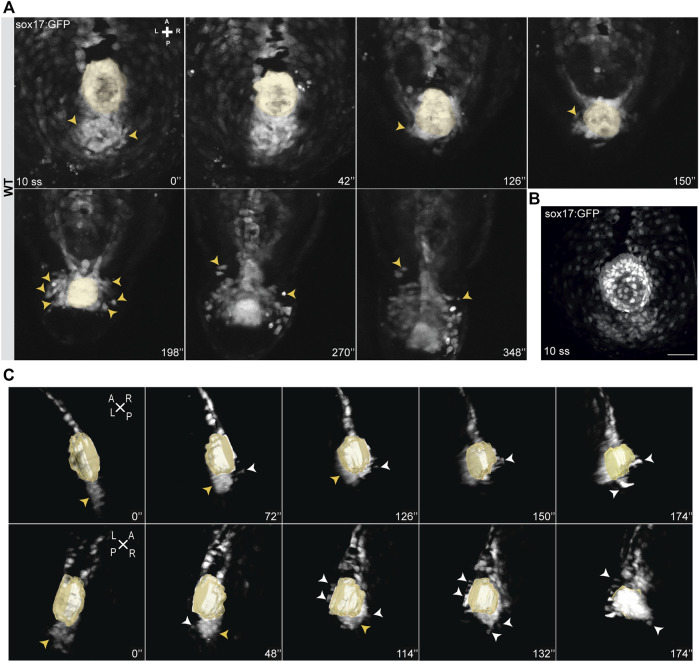
Snapshots from time-lapse live imaging of NKSTCs. (A) Time-lapse imaging of a WT Tg (sox17:GFP) embryo, starting at 10 ss, showing NKSTCs movement from a posterior cluster aligned with the KV. NKSTCs are firstly indicated by yellow arrowheads in the cluster. In the following snapshots, the yellow arrowheads show the first cells that exit the cluster and migrate towards the anterior side from either the left or right side. (B) Maximum intensity projection of a 10 ss Tg(sox17:GFP) fixed embryo showing the ´posterior cluster’ aligned with the KV, scale bar = 50 µm. (C) 3D lateral views of the KV and posterior cluster at 10 ss. Left, yellow arrowheads; right, white arrowheads. Elapsed time is indicated in minutes (‘) at the right and axes are indicated: A, anterior; P, posterior; L, left; R, right. N is shown in parentheses.