- Title
-
Release of STK24/25 suppression on MEKK3 signaling in endothelial cells confers Cerebral cavernous malformation
- Authors
- Yang, X., Wu, S.T., Gao, R., Wang, R., Wang, Y., Dong, Z., Wang, L., Qi, C., Wang, X., Schmitz, M.L., Liu, R., Han, Z., Wang, L., Zheng, X.
- Source
- Full text @ JCI Insight
|
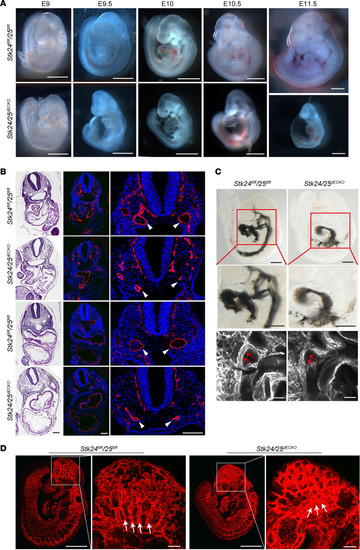
Deletion of Stk24 and Stk25 in endothelium results in vascular defects during embryonic development.
(A) Stereomicroscopic images of developmental time course of littermate Stk24fl/fl;Stk25fl/fl and Stk24/25dECKO mice. Scale bars: 1 mm. (B) H&E staining and Pecam immunostaining of transverse sections of E10 Stk24fl/fl;Stk25fl/fl (n = 3) and Stk24/25dECKO (n = 4) embryos reveal the presence of normally lumenized dorsal aortas (DA) in the Stk24fl/fl;Stk25fl/fl embryos but not in Stk24/25dECKO embryos. White arrowheads indicate dorsal aortas. Scale bars: 100 μm. (C) Images of E9.5 embryo hearts of Stk24fl/fl;Stk25fl/fl (n = 9) and Stk24/25dECKO (n = 6) embryos with injection of Indian ink. Upper and middle panels show embryo overview and magnification of the boxed regions, showing injected ink flows primarily through the second and third BAA to fill the DA in the Stk24fl/fl;Stk25fl/fl embryos. In contrast, ink injected into the heart of Stk24/25dECKO embryos failed to opacify the DA. Accumulation of ink was observed in the heart due to the narrow BAA. Scale bars: 500 μm. Lower panel shows whole-mount immunostaining for the endothelial cell marker, endoglin, showing narrowed BAA and adjacent DA (red arrows) in Stk24/25dECKO embryos. Scale bars: 100μm. (D) Whole-mount immunostaining with endoglin showing the impaired vascular patterning (indicated by the white arrows) in the brain of E9.5 Stk24/25dECKO (n = 6) embryos in comparison with that of Stk24fl/fl;Stk25fl/fl (n = 3) littermate control embryos. Scale bars: 500 μm in overview panels and 100 μm in magnified panels. All the images presented are representatives of 3 or more independent experiments. |
|
Deletion of Stk24 and Stk25 in endothelium of newborn pups disrupt retina vascular extension and filopodia formation.
(A and B) Whole-mount staining of retinal vasculature with IsoB4 in Stk24fl/fl;Stk25fl/fl (n = 5) and Stk24/25idECKO (n = 8) mice at P6. The white line highlights the total retinal area. Scale bars: 500 μm. (C) Quantitative analysis shows reduced retinal vascular outgrowth in Stk24/25idECKO mice compared with that of Stk24fl/fl;Stk25fl/fl mice. Each data point represents 1 mouse. (D–G) IsoB4 whole-mount stainings of P6 retinas show vascular remodeling close to arteries and veins (D and E) and peripheral vessel plexus (F and G) in Stk24fl/fl;Stk25fl/fl mice (n = 4) and Stk24/25idECKO mice (n = 4). A indicates arteries; V denotes veins. Scale bars: 100 μm. (H and I) Confocal images of IsoB4, pH3, and Erg costaining of P6 retina in Stk24fl/fl;Stk25fl/fl mice (n = 6) and Stk24/25idECKO mice (n = 6). The white circle indicates the pH3+ ECs. Scale bars: 100 μm. (J) Quantitative analysis shows increased Erg+ cells but decreased pH3+ ECs in Stk24/25idECKO mice compared with Stk24fl/fl;Stk25fl/fl mice. Each data point represents 1 mouse. (K and L) Confocal images of P6 retina lobe stained with IsoB4 in Stk24/25idECKO mice (n = 5) compared with Stk24fl/fl;Stk25fl/fl mice (n = 3). The red dots denote filopodia in the vascular front. Scale bars: 100 μm. (M) Quantitative analysis showing increased filopodia numbers in Stk24/25idECKO mice compared with Stk24fl/fl;Stk25fl/fl mice. (N–Q) Confocal images and magnification of IsoB4 staining in the cerebral cortical vasculature (N and O) and cerebellum (P and Q) of P8 mouse pups (n = 4 for both Stk24/25idECKO and Stk24fl/fl;Stk25fl/fl). The white arrows indicate the malformation vessel. Scale bars: 100 μm. All the images presented are representatives of 3 or more independent experiments. The quantitative data are presented as mean ± SD, and significance was determined using unpaired t test. ***P < 0.001, **P < 0.01. |
|
Development of cerebral cavernous malformations in the Stk24/25idECKO mice.
(A) Schematic of 4-hydroxytamoxifen (HT) injection and sample collection. Pups were intragastrically injected with 4-HT at P2, and the brain tissues were harvested at specific time points (P7, P8, and P9). Stereomicroscopic images and μCT images of CCM lesions in control and the Stk24/25idECKO mice at P7, P8, and P9. Scale bars: 2 mm. Quantitative analysis of lesion volume in the cerebrum (n = 4) and cerebellum (n = 5) in the Stk24/25idECKO mice is shown on the right. Data in the quantitative plots are presented as mean ± SD. (B) H&E staining of brain sections in Stk24fl/flStk25fl/fl mice (n = 3) at P8 and Stk24/25idECKO mice (n = 3) at P7, P8, and P9. CCM lesions are shown as red masses. Scale bars: 100 μm. (C) Immunostainings of Pecam show cavernomas and reduced vascular number in Stk24/25idECKO mice (n = 4) compared with Stk24fl/fl;Stk25fl/fl mice (n = 4). The white arrowheads indicate malformed vessels. Scale bars: 50 μm. (D) The survival curve of Stk24/25idECKO (n = 20) and Stk24fl/fl;Stk25fl/fl (n = 21) mice after 4-HT induction at P2. Statistical analysis was performed using the Mantel-Cox test. ****P < 0.0001. Representative images from at least 3 or more independent experiments are shown. |
|
Limited induction time window of CCM formation in the Stk24- and Stk25-deficient mice.
(A) Schematic of 4-HT injection and sample collection. Pups were intragastrically injected with 4-HT at P5, and the brain tissues were harvested at P12 and P21. The survival curves of Stk24/25idECKO (n = 14) and Stk24fl/fl;Stk25fl/fl mice (n = 16) after 4-HT induction at P5 are shown below. Statistical analysis was performed using the Mantel-Cox test. ****P < 0.0001. (B) Stereomicroscopic images and μCT images of CCM lesions in Stk24/25idECKO mice at P12 and P21 with 4-HT induction at P5. Scale bars: 2 mm. Quantitative analysis of lesion volume in cerebrum (n = 3) and cerebellum (n = 3) at P12 and P21 is shown on the right. Data are presented as mean ± SD. (C) Stereomicroscopic images and μCT imaging of CCM lesions in Stk24/25idECKO (n = 3) mice after tamoxifen induction at P7. Scale bars: 2 mm. (D) H&E staining of brain sections and whole-mount images showing CCM in brain and retina of Stk24fl/fl;Stk25fl/fl (n = 3) and Stk24/25idECKO mice (n = 3) at different time points. Scale bars: 200 μm. (E) Stereomicroscopic images and μCT images showing diminished CCM lesion formation in the Stk24/25idECKO mice (n = 3) at P30 after tamoxifen induction starting at P10. Scale bars: 2 mm. (F) Stereomicroscopic images and μCT imaging showing near absence of CCM lesion formation in the Stk24/25idECKO mice (n = 3) at P29 after tamoxifen induction starting at P15. Scale bars: 2 mm. Representative images from 3 or more independent experiments are shown. |
|
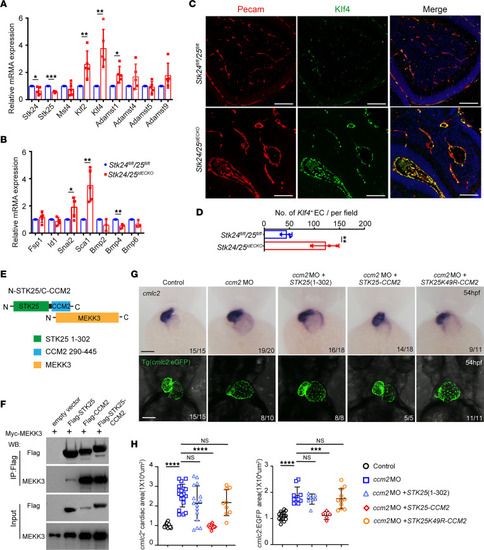
Stk24 and Stk25 deletion induces CCMs via MEKK3-KLF2/4 signaling activation.
(A and B) Relative mRNA expression level of CCM-related genes in endothelial cells isolated from control and Stk24/25idECKO mice at P6 after induction at P2. n = 5 for each group — except Bmp2, Bmp4, and Bmp6, for which n = 3 was used. (C) Pecam and Klf4 immunofluorescence staining in endothelial cells of Stk24fl/fl;Stk25fl/fl (n = 3) and Stk24/25idECKO mouse brains (n = 3) at P6 after induction at P2. Scale bars: 100 μm. (D) Quantitative analysis showing increased Klf4+ EC in Stk24/25idECKO mice compared with Stk24fl/fl;Stk25fl/fl mice. The quantitative data (mean ± SD) from 3 independent experiments are reported, and significance was determined using unpaired t test. **P < 0.01. (E) Schematic representation of the interaction between MEKK3 and STK25-CCM2 hybrid protein consists of N terminal kinase domain of STK and C terminal MEKK3 interacting domain of CCM2. (F) Immunoprecipitation experiment shows that STK25/CCM2 hybrid protein interaction with MEKK3 was comparable with that of CCM2. (G) Representative images of in situ staining of cmlc2 and fluorescence imaging of the hearts of Tg (cmlc2:EGFP) zebrafish embryos in which myocardial cells express EGFP. The ccm2 morpholino induced dilated heart, while coinjection with mRNA expressing STK25-CCM2 rescued the dilated heart phenotype compared with injection of mRNA only expressing STK25(1-302) or STK25K49R-CCM2 hybrid protein. Scale bars: 100 μm. (H) Quantification of cmlc2+ cardiac area and cmlc2:EGFP area of zebrafish embryos with ccm2 morpholino and different cRNA. Data are presented as mean ± SD, and significance was determined using unpaired t test (A, B, and D) or 1-way ANOVA (H). *P < 0.05, **P < 0.01, ***P < 0.001, ****P < 0.0001. PHENOTYPE:
|


