Figure 2
- ID
- ZDB-FIG-230407-30
- Publication
- Yang et al., 2023 - Release of STK24/25 suppression on MEKK3 signaling in endothelial cells confers Cerebral cavernous malformation
- Other Figures
- All Figure Page
- Back to All Figure Page
|
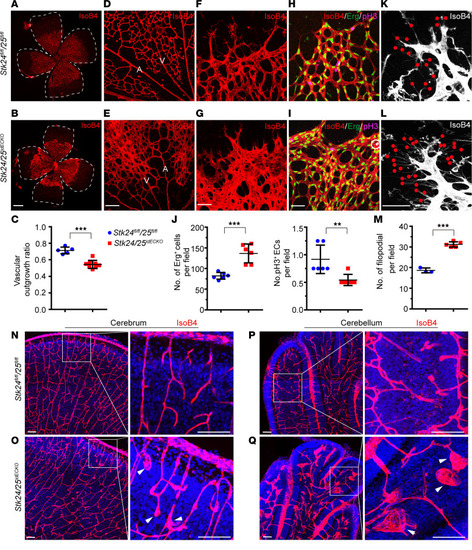
Deletion of Stk24 and Stk25 in endothelium of newborn pups disrupt retina vascular extension and filopodia formation.
(A and B) Whole-mount staining of retinal vasculature with IsoB4 in Stk24fl/fl;Stk25fl/fl (n = 5) and Stk24/25idECKO (n = 8) mice at P6. The white line highlights the total retinal area. Scale bars: 500 μm. (C) Quantitative analysis shows reduced retinal vascular outgrowth in Stk24/25idECKO mice compared with that of Stk24fl/fl;Stk25fl/fl mice. Each data point represents 1 mouse. (D–G) IsoB4 whole-mount stainings of P6 retinas show vascular remodeling close to arteries and veins (D and E) and peripheral vessel plexus (F and G) in Stk24fl/fl;Stk25fl/fl mice (n = 4) and Stk24/25idECKO mice (n = 4). A indicates arteries; V denotes veins. Scale bars: 100 μm. (H and I) Confocal images of IsoB4, pH3, and Erg costaining of P6 retina in Stk24fl/fl;Stk25fl/fl mice (n = 6) and Stk24/25idECKO mice (n = 6). The white circle indicates the pH3+ ECs. Scale bars: 100 μm. (J) Quantitative analysis shows increased Erg+ cells but decreased pH3+ ECs in Stk24/25idECKO mice compared with Stk24fl/fl;Stk25fl/fl mice. Each data point represents 1 mouse. (K and L) Confocal images of P6 retina lobe stained with IsoB4 in Stk24/25idECKO mice (n = 5) compared with Stk24fl/fl;Stk25fl/fl mice (n = 3). The red dots denote filopodia in the vascular front. Scale bars: 100 μm. (M) Quantitative analysis showing increased filopodia numbers in Stk24/25idECKO mice compared with Stk24fl/fl;Stk25fl/fl mice. (N–Q) Confocal images and magnification of IsoB4 staining in the cerebral cortical vasculature (N and O) and cerebellum (P and Q) of P8 mouse pups (n = 4 for both Stk24/25idECKO and Stk24fl/fl;Stk25fl/fl). The white arrows indicate the malformation vessel. Scale bars: 100 μm. All the images presented are representatives of 3 or more independent experiments. The quantitative data are presented as mean ± SD, and significance was determined using unpaired t test. ***P < 0.001, **P < 0.01. |

