
|
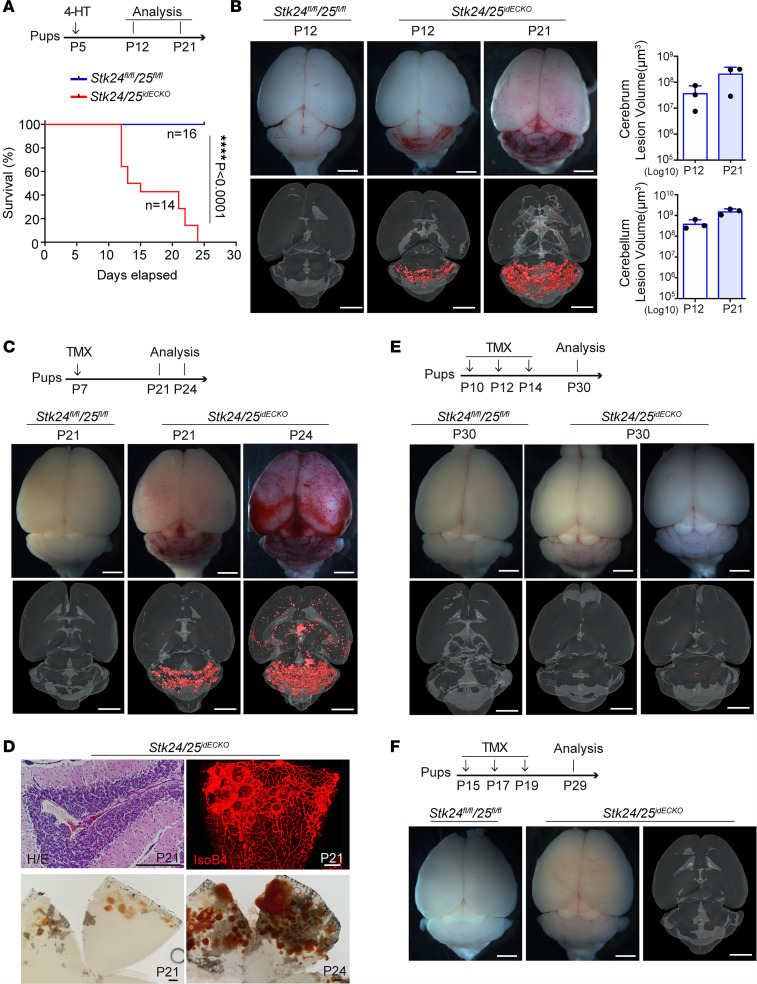
Figure 4
(A) Schematic of 4-HT injection and sample collection. Pups were intragastrically injected with 4-HT at P5, and the brain tissues were harvested at P12 and P21. The survival curves of Stk24/25idECKO (n = 14) and Stk24fl/fl;Stk25fl/fl mice (n = 16) after 4-HT induction at P5 are shown below. Statistical analysis was performed using the Mantel-Cox test. ****P < 0.0001. (B) Stereomicroscopic images and μCT images of CCM lesions in Stk24/25idECKO mice at P12 and P21 with 4-HT induction at P5. Scale bars: 2 mm. Quantitative analysis of lesion volume in cerebrum (n = 3) and cerebellum (n = 3) at P12 and P21 is shown on the right. Data are presented as mean ± SD. (C) Stereomicroscopic images and μCT imaging of CCM lesions in Stk24/25idECKO (n = 3) mice after tamoxifen induction at P7. Scale bars: 2 mm. (D) H&E staining of brain sections and whole-mount images showing CCM in brain and retina of Stk24fl/fl;Stk25fl/fl (n = 3) and Stk24/25idECKO mice (n = 3) at different time points. Scale bars: 200 μm. (E) Stereomicroscopic images and μCT images showing diminished CCM lesion formation in the Stk24/25idECKO mice (n = 3) at P30 after tamoxifen induction starting at P10. Scale bars: 2 mm. (F) Stereomicroscopic images and μCT imaging showing near absence of CCM lesion formation in the Stk24/25idECKO mice (n = 3) at P29 after tamoxifen induction starting at P15. Scale bars: 2 mm. Representative images from 3 or more independent experiments are shown.