
- Title
-
Renal interstitial cells promote nephron regeneration by secreting prostaglandin E2
- Authors
- Liu, X., Yu, T., Tan, X., Jin, D., Yang, W., Zhang, J., Dai, L., He, Z., Li, D., Zhang, Y., Liao, S., Zhao, J., Zhong, T.P., Liu, C.
- Source
- Full text @ Elife
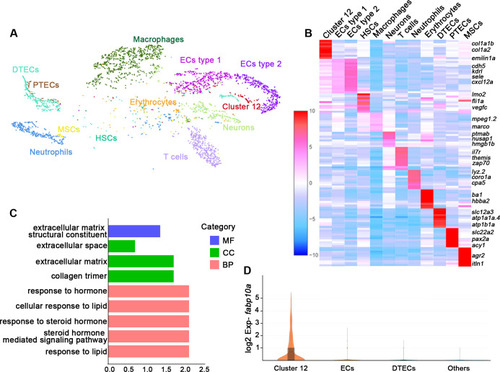
(A) A tSNE plot showing clustering of all kidney cells after alignment using the Seurat package. Cells clustered with resolution 0.6. (B) Heat map showing relative log-expression of the top 2 or 3 marker genes for each cell cluster in A. (C) GO analysis of differentially expressed genes of cluster 12. A false discovery rate <0.05 was considered to indicate significant enrichment. BP, biological process; CC, cellular component; MF, molecular function. (D) Expression analysis of fabp10a in all clusters, showing that fabp10a was specifically expressed in cluster 12. DTECs, distal tubule epithelial cells; PTECs, proximal tubule epithelial cells; ECs, endothelial cells; HSCs, hematopoietic stem cells; MSCs, mucin-secreting cells; Exp, expression.
|
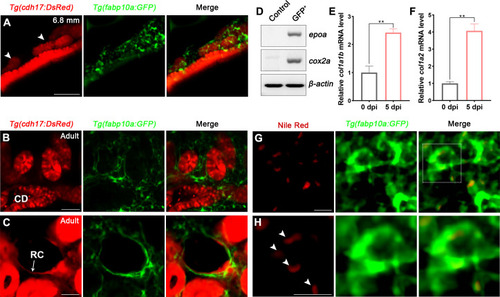
(A) Localization of Tg(fabp10a:GFP) labeled-RICs in 6.8 mm stage juvenile zebrafish. Tg(cdh17:DsRed) labeled renal tubules (arrowheads, new mesonephric branches; n = 6). (B, C) In adult zebrafish kidney, Tg(fabp10a:GFP) marks RICs (n = 3), while Tg(cdh17:DsRed) labels CD and also renal capsule (RC). Tg(fabp10a:GFP) cells form a network to tightly wrap kidney tubules (B) and capsules (C). CD, collecting duct; RC, renal capsule. (D) RT-PCR analysis of the expression of epoa and cox2a. β-actin was used as a sample control. GFP+ indicates cells with only GFP fluorescence; control indicates all cells except GFP+/DsRed- cells. (E, F) col1a1b and col1a2 mRNA levels in Tg(fabp10a:GFP)-labeled GFP+/DsRed- cells were quantified by qPCR. Both were significantly increased at 5 dpi (n = 3). Both genes were normalized to the mean expression level at 0 dpi, which was set to 1. **p<0.01 by one-way ANOVA. (G) Nile red staining section of Tg(fabp10a:GFP) zebrafish kidney showing that Tg(fabp10a:GFP)-labeled cells contained plentiful lipid droplets. (H) Higher-magnification image of the boxed area showed in (G) (arrowheads, lipid droplets). n = 3. Scale bar in (A–C), 100 μm; (G, H), 20 μm.
|
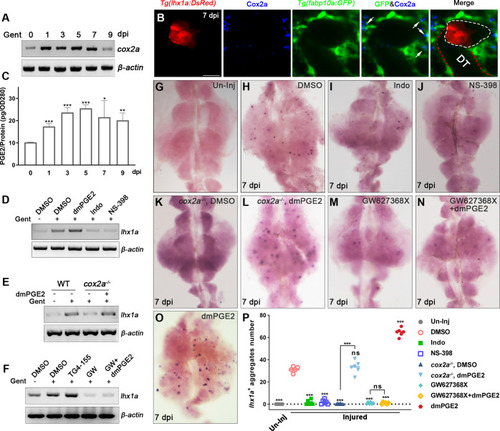
(A) cox2a mRNA levels were evaluated by RT-PCR at 0, 1, 3, 5, 7, and 9 dpi. β-actin was used as a sample control. The expression of cox2a was upregulated after acute kidney injury (AKI) and reached its peak level at 5 dpi (n = 3). (B) Immunofluorescence staining of Cox2a in Tg(fabp10a:GFP;lhx1a:DsRed) zebrafish kidneys at 7 dpi. RICs around lhx1a+ cell aggregates highly expressed Cox2a (arrows; DT, distal tubule, red outline; lhx1a+ cell aggregates, white outline; n = 4) Scale bar, 50 μm. (C) PGE2 levels were assessed at 0, 1, 3, 5, 7, and 9 dpi using PGE2 ELISA kits. PGE2 levels increased after AKI and reached their peak at 5 dpi (n = 3). Data were analyzed by ANOVA, *p<0.05, **p<0.01, ***p<0.001 vs 0 dpi. (D) lhx1a mRNA levels were evaluated by RT-PCR at 7 dpi. (E) The lhx1a mRNA levels in cox2a-/- and WT zebrafish kidneys were assessed by RT-PCR at 7 dpi. (F) The lhx1a mRNA levels were determined by RT-PCR at 7 dpi after injection of EP2 inhibitor TG4-155 or EP4 inhibitor GW627368X (GW). β-actin was used as a sample control in (D–F). (G–O) lhx1a WISH showing the trunk kidney region at 7 dpi (n = 5–7). (G) lhx1a + cell aggregates could not be detected in un-injured (Un-Inj) kidneys. (H) Injury induced the formation of lhx1a+ cell aggregates. Indo (I), NS-398 (J), or Cox2a deficiency (K) inhibited the formation of lhx1a+ cell aggregates. dmPGE2 could rescue the effect of Cox2a deficiency (L). GW627368X inhibited the formation of lhx1a+ cell aggregates (M), and dmPGE2 could not rescue the defect (N). dmPGE2 could promote the formation of lhx1a+ cell aggregates (O). (P) lhx1a+ cell aggregates in uninjured and injured kidneys that were treated with DMSO, COX inhibitors or dmPGE2 were calculated using ImageJ. n = 5–7 in each condition. Data were analyzed by ANOVA, *p<0.05, **p<0.01, ***p<0.001.
|
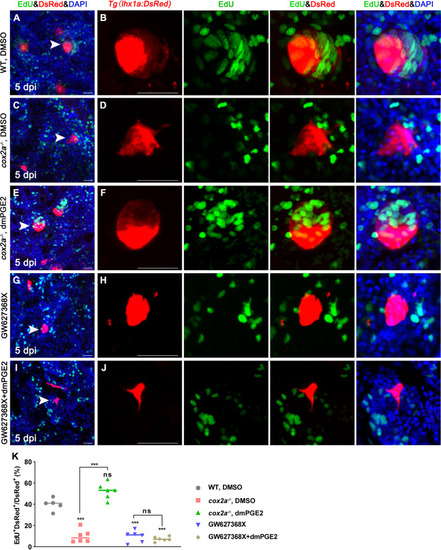
Tg(lhx1a:DsRed) fish were injected with EdU to label proliferating nuclei at 5 dpi and kidneys were harvested 3 hr later. (A, B) Gentamicin induced lhx1a+ cell aggregates with proliferating EdU+ nuclei. (C, D) The proliferation of lhx1a+ cell aggregates in cox2a-/- was significantly less than that in WT. (E, F) Intraperitoneal injection of dmPGE2 could promote the proliferation of lhx1a+ cells in cox2a-/-. (G, H) GW627368X inhibited the proliferation of lhx1a+ cells. (I, J) Injection of dmPGE2 could not rescue the GW627368X treatment. n = 5–7 in each condition. Scale bar in (A, C, E, G, I), 50 μm; (B, D, F, H, J), 100 μm. The images on the right showed a higher-magnification image (arrowheads). (K) Proliferation ratio of lhx1a+ RPCs in (A–J) was calculated using ImageJ. n = 5–7 in each condition. Data were analyzed by ANOVA, ***p<0.001; ns, no significant difference.
|
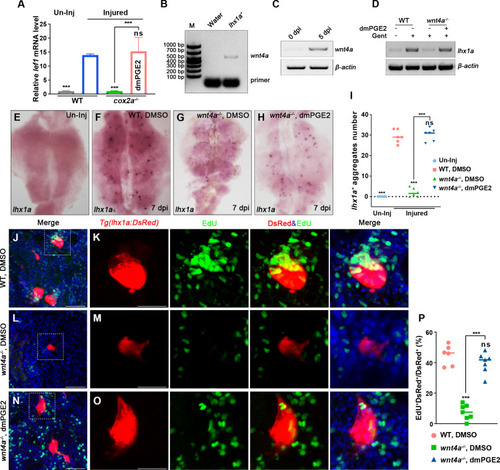
(A) qPCR relative quantification of lef1 mRNA in kidney tissue of WT and cox2a-/- harvested at 7 dpi. Gene was normalized to the mean expression level in uninjured (Un-Inj) kidneys, which was set to 1. **p<0.01, ***p<0.001; ns, no significant difference (n = 3). (B) FACS-related RT-PCR analysis of wnt4a expression in Tg(lhx1a:DsRed) labeled RPCs at 5 dpi, and wnt4a was expressed in these cells. (C) The wnt4a mRNA levels were assessed by RT-PCR in uninjured or injured kidneys. (D) lhx1a mRNA levels were evaluated by RT-PCR in wnt4a-/- and WT zebrafish kidneys at 7 dpi. β-actin was used as a sample control. (E–H) lhx1a whole-mount in situ hybridization (WISH) showing the trunk kidney region at 7 dpi. (G) the number of lhx1a+ cell aggregates in wnt4a-/- was less than that in WT. (H) Injection of dmPGE2 could rescue the influence of Wnt4a deficiency. (I) lhx1a+ cell aggregates of whole kidney were calculated using ImageJ. n = 5–7 fish for each condition. Data were analyzed by ANOVA, ***p<0.001; ns, no significant difference. (J, K) Gentamicin induced lhx1a+ new nephrons with proliferating EdU+ nuclei at 5 dpi (n = 5). (L, M) The proliferation of lhx1a+ cells in wnt4a-/- was significantly less than that in WT (n = 6). (N, O) dmPGE2 could rescue the effect of Wnt4a deficiency and recover the proliferation of lhx1a+ cells in wnt4a-/- (n = 6). (K, M, O) show the higher-magnification images of the boxed areas showed in (J, L, N). Scale bar in (J–O), 100 μm. (G) Proliferation ratio of lhx1a+ RPCs in (J–O) was calculated using ImageJ. n = 5–7 in each condition. Data were analyzed by ANOVA, ***p<0.001; ns, no significant difference.
|
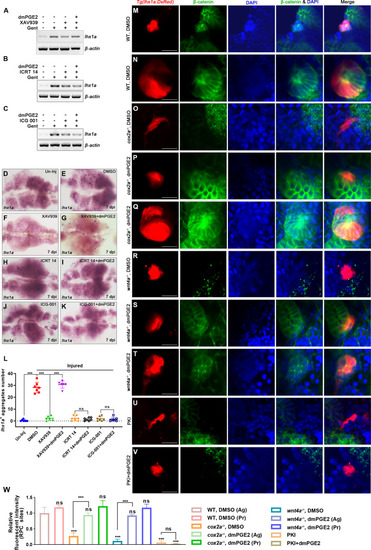
(A–C) lhx1a mRNA levels were assessed by RT-PCR at 7 dpi. β-actin was used as a sample control. (D–K) lhx1a whole-mount in situ hybridization (WISH) showing the trunk kidney region at 7 dpi. XAV939 (F) could reduce the number of lhx1a + cell aggregates and dmPGE2 could rescue the influence of XAV939 treatment (G); ICRT 14 (H) or ICG-001 (J) could reduce the number of lhx1a+ cell aggregates and dmPGE2 could not rescue the influence of ICRT 14 (I) or ICG-001 (K) treatment. n = 5–7 in each condition. (L) lhx1a+ cell aggregates of whole kidney were calculated using ImageJ. Data were analyzed by ANOVA, ***p<0.001; ns, no significant difference. (M–V) Immunofluorescence staining of β-catenin in Tg(lhx1a:DsRed) zebrafish kidneys at 5 dpi. (M, N) Zebrafish injected DMSO as a control group, and the amount of β-catenin could be detected in lhx1a+ cell aggregates during renal progenitor cell (RPC) aggregation (M) or proliferation (N). (O) β-catenin level in lhx1a+ cell aggregates of cox2a-/- was significantly less than the control group, and injection of dmPGE2 (P, Q) could rescue the influence of Cox2a deficiency. (R) β-catenin level in lhx1a+ cell aggregates of wnt4a-/- was significantly less than the control group, and injection of dmPGE2 (S, T) could rescue the influence of Wnt4a deficiency. Injection of PKI (U) could reduce β-catenin level in lhx1a+ cell aggregates, while injection of dmPGE2 (V) could not rescue the influence of PKI treatment. n = 3–6 in (M–V). Scale bar in (M–V), 50 μm. (W) Bar chart depicting β-catenin levels following acute kidney injury (AKI) (M–V). Fluorescent intensities per unit area were measured at the lhx1a+ RPC aggregates using ImageJ. β-catenin levels of lhx1a+ RPCs during RPC aggregation normalized as 1. Ag, aggregation; Pr, proliferation. n = 3–6 in each condition. Data were analyzed by ANOVA, ***p<0.001; ns, no significant difference.
|
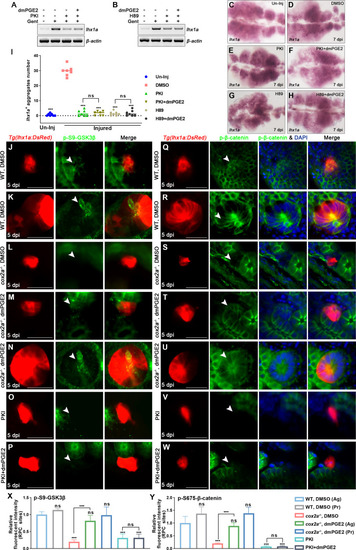
(A, B) lhx1a mRNA levels were evaluated by RT-PCR at 7 dpi. β-actin was used as a sample control. (C–H) lhx1a whole-mount in situ hybridization (WISH) showing the trunk kidney region at 7 dpi. PKI (E) or H89 (G) treatment reduced the number of lhx1a+ cell aggregates, while injection of dmPGE2 could not rescue the influence of PKI (F) or H89 (H) treatment. (I) lhx1a+ cell aggregates of whole kidney were calculated using ImageJ. n = 5–7 in each condition. Data were analyzed by ANOVA, ***p<0.001; ns, no significant difference. (J–N) Immunofluorescence staining of p-S9-GSK3β (arrowheads) in Tg(lhx1a:DsRed) zebrafish kidneys at 5 dpi. (J, K) Zebrafish injected with DMSO as a control group, and the amount of p-S9-GSK3β could be detected in lhx1a+ cell aggregates cytoplasm during RPC aggregation (J) or proliferation (K). (L) p-S9-GSK3β in lhx1a+ cell aggregates of cox2a-/- was hardly detectable, and injection of dmPGE2 (M, N) could rescue the influence of Cox2a deficiency. Injection of PKI (O) could reduce p-S9-GSK3β level in lhx1a+ cell aggregates, while injection of dmPGE2 (P) could not rescue the influence of PKI treatment. (Q–W) Immunofluorescence staining of p-S675-β-catenin in Tg(lhx1a:DsRed) zebrafish kidneys at 5 dpi. (Q, R) Injection of DMSO as a control group and amounts of p-S675-β-catenin could be detected in lhx1a+ cell aggregates during RPC aggregation (Q) or proliferation (R). (S) p-S675-β-catenin level in lhx1a+ cell aggregates of cox2a-/- was hardly detectable, and injection of dmPGE2 (T, U) could rescue the influence of Cox2a deficiency. Injection of PKI (V) could reduce p-S675-β-catenin level in lhx1a+ cell aggregates, while injection of dmPGE2 (W) could not rescue the influence of PKI treatment. Scale bar, 50 μm. (X, Y) Bar chart depicting p-S9-GSK3β (X) and p-S675-β-catenin (Y) levels following acute kidney injury (AKI) (J–W). Fluorescent intensities per unit area were measured at the lhx1a+ RPC aggregates using ImageJ. p-S9-GSK3β or p-S675-β-catenin levels of lhx1a+ RPCs during RPC aggregation normalized as 1. Ag, aggregation; Pr, proliferation. n = 3–6 in each condition. Data were analyzed by ANOVA, ***p<0.001; ns, no significant difference.
|
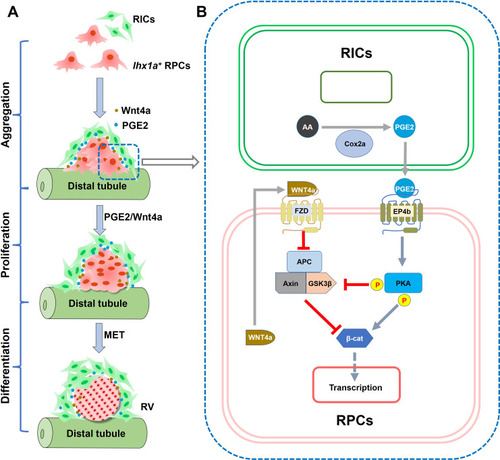
(A) Diagram of RV formation process. During nephron regeneration, renal progenitor cells (RPCs) congregate to form cell aggregate, then renal interstitial cells (RICs) form a network to wrap the RPC aggregate and secrete PGE2. RIC-secreted PGE2 and RPC-secreted Wnt4a synergistically promote RPCs to proliferate rapidly and then differentiate into RV. (B) Model of the interaction between PGE2 and Wnt signaling pathway in RPC during regeneration. During nephron regeneration, RICs that are in close contact with RPC aggregates express Cox2a and secrete PGE2. PGE2 signaling interacts with Wnt/β-catenin pathway at the level of β-catenin destruction complex and direct modification of β-catenin stability in RPC. This is achieved through EP4b induction and the activation of PKA. PKA phosphorylates GSK3β at Ser9, preventing the assembly of the β-catenin destruction complex. PKA also phosphorylates β-catenin at Ser675, resulting in stabilization of β-catenin. Wnt4a secreted by RPC can also reduce the stability of the destruction complex through the FZD receptor, thereby enhancing stabilization of β-catenin in response to acute kidney injury (AKI).
|