
Figure 1
- ID
- ZDB-FIG-230223-1
- Publication
- Liu et al., 2023 - Renal interstitial cells promote nephron regeneration by secreting prostaglandin E2
- Other Figures
- All Figure Page
- Back to All Figure Page
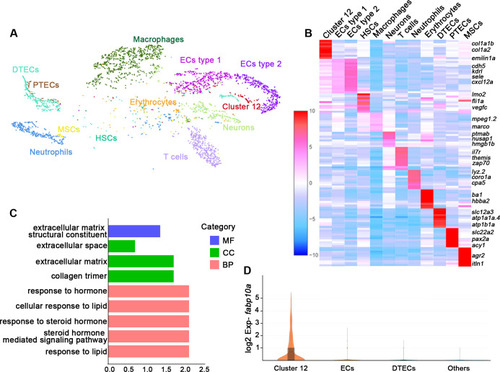
(A) A tSNE plot showing clustering of all kidney cells after alignment using the Seurat package. Cells clustered with resolution 0.6. (B) Heat map showing relative log-expression of the top 2 or 3 marker genes for each cell cluster in A. (C) GO analysis of differentially expressed genes of cluster 12. A false discovery rate <0.05 was considered to indicate significant enrichment. BP, biological process; CC, cellular component; MF, molecular function. (D) Expression analysis of fabp10a in all clusters, showing that fabp10a was specifically expressed in cluster 12. DTECs, distal tubule epithelial cells; PTECs, proximal tubule epithelial cells; ECs, endothelial cells; HSCs, hematopoietic stem cells; MSCs, mucin-secreting cells; Exp, expression.
|