Figure 5
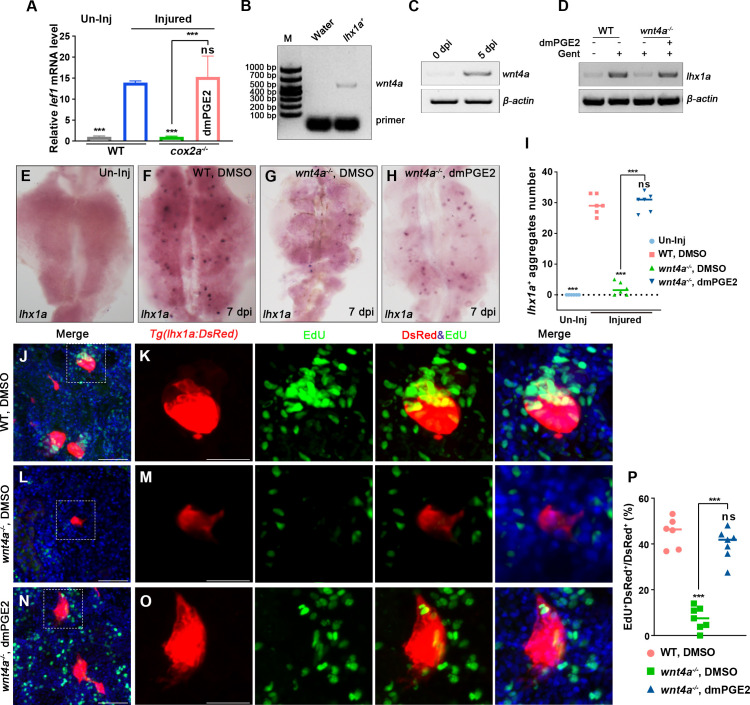
(A) qPCR relative quantification of lef1 mRNA in kidney tissue of WT and cox2a-/- harvested at 7 dpi. Gene was normalized to the mean expression level in uninjured (Un-Inj) kidneys, which was set to 1. **p<0.01, ***p<0.001; ns, no significant difference (n = 3). (B) FACS-related RT-PCR analysis of wnt4a expression in Tg(lhx1a:DsRed) labeled RPCs at 5 dpi, and wnt4a was expressed in these cells. (C) The wnt4a mRNA levels were assessed by RT-PCR in uninjured or injured kidneys. (D) lhx1a mRNA levels were evaluated by RT-PCR in wnt4a-/- and WT zebrafish kidneys at 7 dpi. β-actin was used as a sample control. (E–H) lhx1a whole-mount in situ hybridization (WISH) showing the trunk kidney region at 7 dpi. (G) the number of lhx1a+ cell aggregates in wnt4a-/- was less than that in WT. (H) Injection of dmPGE2 could rescue the influence of Wnt4a deficiency. (I) lhx1a+ cell aggregates of whole kidney were calculated using ImageJ. n = 5–7 fish for each condition. Data were analyzed by ANOVA, ***p<0.001; ns, no significant difference. (J, K) Gentamicin induced lhx1a+ new nephrons with proliferating EdU+ nuclei at 5 dpi (n = 5). (L, M) The proliferation of lhx1a+ cells in wnt4a-/- was significantly less than that in WT (n = 6). (N, O) dmPGE2 could rescue the effect of Wnt4a deficiency and recover the proliferation of lhx1a+ cells in wnt4a-/- (n = 6). (K, M, O) show the higher-magnification images of the boxed areas showed in (J, L, N). Scale bar in (J–O), 100 μm. (G) Proliferation ratio of lhx1a+ RPCs in (J–O) was calculated using ImageJ. n = 5–7 in each condition. Data were analyzed by ANOVA, ***p<0.001; ns, no significant difference.
PGE2–EP4 signaling promotes nephron regeneration through PGE2/Wnt interaction.
Image
Figure Caption
Acknowledgments
This image is the copyrighted work of the attributed author or publisher, and
ZFIN has permission only to display this image to its users.
Additional permissions should be obtained from the applicable author or publisher of the image.
Full text @ Elife

