
Figure 7
- ID
- ZDB-FIG-230223-18
- Publication
- Liu et al., 2023 - Renal interstitial cells promote nephron regeneration by secreting prostaglandin E2
- Other Figures
- All Figure Page
- Back to All Figure Page
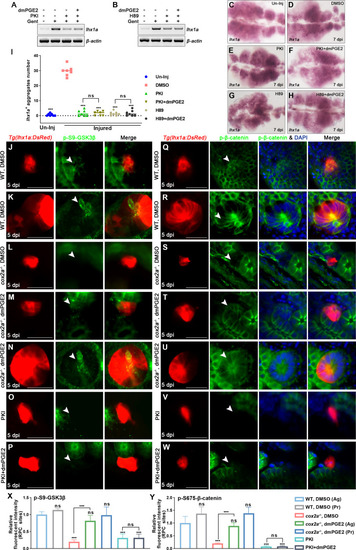
(A, B) lhx1a mRNA levels were evaluated by RT-PCR at 7 dpi. β-actin was used as a sample control. (C–H) lhx1a whole-mount in situ hybridization (WISH) showing the trunk kidney region at 7 dpi. PKI (E) or H89 (G) treatment reduced the number of lhx1a+ cell aggregates, while injection of dmPGE2 could not rescue the influence of PKI (F) or H89 (H) treatment. (I) lhx1a+ cell aggregates of whole kidney were calculated using ImageJ. n = 5–7 in each condition. Data were analyzed by ANOVA, ***p<0.001; ns, no significant difference. (J–N) Immunofluorescence staining of p-S9-GSK3β (arrowheads) in Tg(lhx1a:DsRed) zebrafish kidneys at 5 dpi. (J, K) Zebrafish injected with DMSO as a control group, and the amount of p-S9-GSK3β could be detected in lhx1a+ cell aggregates cytoplasm during RPC aggregation (J) or proliferation (K). (L) p-S9-GSK3β in lhx1a+ cell aggregates of cox2a-/- was hardly detectable, and injection of dmPGE2 (M, N) could rescue the influence of Cox2a deficiency. Injection of PKI (O) could reduce p-S9-GSK3β level in lhx1a+ cell aggregates, while injection of dmPGE2 (P) could not rescue the influence of PKI treatment. (Q–W) Immunofluorescence staining of p-S675-β-catenin in Tg(lhx1a:DsRed) zebrafish kidneys at 5 dpi. (Q, R) Injection of DMSO as a control group and amounts of p-S675-β-catenin could be detected in lhx1a+ cell aggregates during RPC aggregation (Q) or proliferation (R). (S) p-S675-β-catenin level in lhx1a+ cell aggregates of cox2a-/- was hardly detectable, and injection of dmPGE2 (T, U) could rescue the influence of Cox2a deficiency. Injection of PKI (V) could reduce p-S675-β-catenin level in lhx1a+ cell aggregates, while injection of dmPGE2 (W) could not rescue the influence of PKI treatment. Scale bar, 50 μm. (X, Y) Bar chart depicting p-S9-GSK3β (X) and p-S675-β-catenin (Y) levels following acute kidney injury (AKI) (J–W). Fluorescent intensities per unit area were measured at the lhx1a+ RPC aggregates using ImageJ. p-S9-GSK3β or p-S675-β-catenin levels of lhx1a+ RPCs during RPC aggregation normalized as 1. Ag, aggregation; Pr, proliferation. n = 3–6 in each condition. Data were analyzed by ANOVA, ***p<0.001; ns, no significant difference.
|