
Figure 3
- ID
- ZDB-FIG-230223-5
- Publication
- Liu et al., 2023 - Renal interstitial cells promote nephron regeneration by secreting prostaglandin E2
- Other Figures
- All Figure Page
- Back to All Figure Page
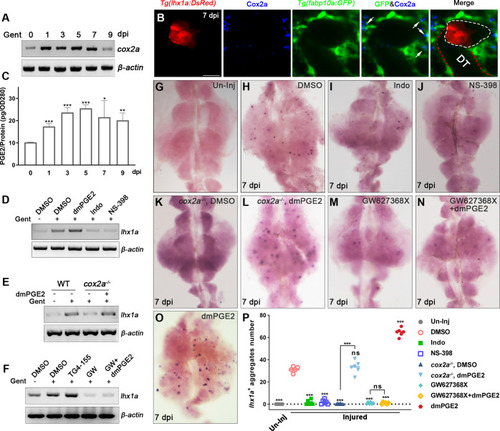
(A) cox2a mRNA levels were evaluated by RT-PCR at 0, 1, 3, 5, 7, and 9 dpi. β-actin was used as a sample control. The expression of cox2a was upregulated after acute kidney injury (AKI) and reached its peak level at 5 dpi (n = 3). (B) Immunofluorescence staining of Cox2a in Tg(fabp10a:GFP;lhx1a:DsRed) zebrafish kidneys at 7 dpi. RICs around lhx1a+ cell aggregates highly expressed Cox2a (arrows; DT, distal tubule, red outline; lhx1a+ cell aggregates, white outline; n = 4) Scale bar, 50 μm. (C) PGE2 levels were assessed at 0, 1, 3, 5, 7, and 9 dpi using PGE2 ELISA kits. PGE2 levels increased after AKI and reached their peak at 5 dpi (n = 3). Data were analyzed by ANOVA, *p<0.05, **p<0.01, ***p<0.001 vs 0 dpi. (D) lhx1a mRNA levels were evaluated by RT-PCR at 7 dpi. (E) The lhx1a mRNA levels in cox2a-/- and WT zebrafish kidneys were assessed by RT-PCR at 7 dpi. (F) The lhx1a mRNA levels were determined by RT-PCR at 7 dpi after injection of EP2 inhibitor TG4-155 or EP4 inhibitor GW627368X (GW). β-actin was used as a sample control in (D–F). (G–O) lhx1a WISH showing the trunk kidney region at 7 dpi (n = 5–7). (G) lhx1a + cell aggregates could not be detected in un-injured (Un-Inj) kidneys. (H) Injury induced the formation of lhx1a+ cell aggregates. Indo (I), NS-398 (J), or Cox2a deficiency (K) inhibited the formation of lhx1a+ cell aggregates. dmPGE2 could rescue the effect of Cox2a deficiency (L). GW627368X inhibited the formation of lhx1a+ cell aggregates (M), and dmPGE2 could not rescue the defect (N). dmPGE2 could promote the formation of lhx1a+ cell aggregates (O). (P) lhx1a+ cell aggregates in uninjured and injured kidneys that were treated with DMSO, COX inhibitors or dmPGE2 were calculated using ImageJ. n = 5–7 in each condition. Data were analyzed by ANOVA, *p<0.05, **p<0.01, ***p<0.001.
|