
- Title
-
Methodological advancements in organ-specific ectopic lipid quantitative characterization: Effects of high fat diet on muscle and liver intracellular lipids
- Authors
- Grepper, D., Tabasso, C., Aguettaz, A., Martinotti, A., Ebrahimi, A., Lagarrigue, S., Amati, F.
- Source
- Full text @ Mol Metab
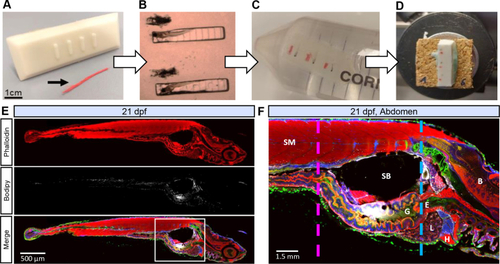
Stepwise larvae embedding, cryopreservation and cryosectioning. (A) Custom mold used to form imprints in embedding medium and red waxed dental floss used to mark region of interest (black arrowhead). For exact dimensions, see supplemental data. (B) Fixed whole larvae are aligned in imprints. (C) After covering with embedding medium, blocks are shaped and cryoprotected with sucrose. (D) Blocks are frozen in liquid nitrogen and cut with the cryostat. (E) Representative sagittal section of 21 dpf larva fed with normal diet (14% fat diet). (F) Close view of the abdomen with muscle (pink dashed line) and liver landmarks (blue dashed line). B: Brain, E: Esophagus, G: Gut, H: Heart, L: Liver, SB: Swim Bladder, SM: Skeletal Muscle. Actin labeled with phalloidin (red), cell membrane labeled with WGA (green), LDs stained with Bodipy665 (white), nuclei stained with Hoechst (blue). |
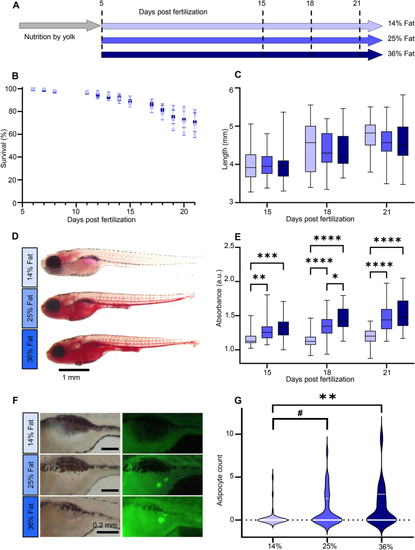
Study design and high fat diets validation. (A) Experimental design. Three cohorts of 50 larvae per group were studied at 15, 18 and 21 dpf. (B) Survival curve. Bars represent mean ± SEM. Starting n = 250 in three independent cohorts (3 × 3 ANOVA main effect of diet (F(2, 111) = 0.499, p = 0.609)). (C) Larvae length. Whiskers represent min. to max., n = 36 pooled from three independent cohorts (3 × 3 ANOVA main effect of diet (F(2, 317) = 1.628, p = 0.198)). (D) Representative Oil red O (ORO) images of 21 dpf larvae. (E) ORO extraction absorbance at 495 nm normalized to unstained samples. Whiskers represent min. to max., n = 36 per diet for each of the three independent experiments. (F) Representative Nile Red images of visceral adipocytes at 21 dpf. (G) Adipocyte count distribution per diet. Median and 75th quartile are shown by white lines, n = 33 per diet (Kruskal–Wallis test with Dunn’s multiple comparisons correction). For all panels: #p = 0.0525, ∗p < 0.05, ∗∗p ≤ 0.01, ∗∗∗p < 0.001, ∗∗∗∗p < 0.0001. |
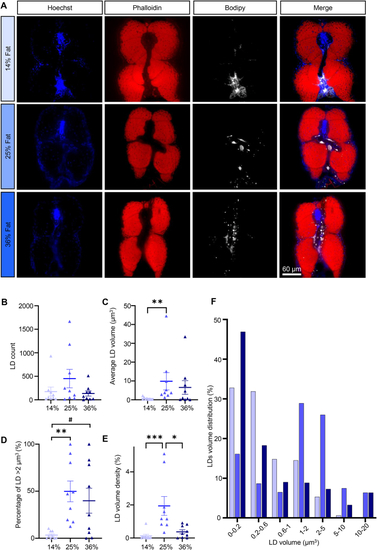
Intramyocellular lipids. (A) Representative images of skeletal muscle sections in 21 dpf larvae. Nuclei stained with Hoechst (blue), actin stained with phalloidin (red), LDs stained with Bodipy665 (white). (B) LD count per fish. (C) Average LD volume per fish. (D) Percentage of LDs with a volume >2 μm3. (E) LD volume density. (F) LD volume distribution. Bars represent mean ± SEM, n = 9 pooled from three independent experiments (Kruskal–Wallis test with Dunn’s multiple comparisons correction). For all panels: #p = 0.0586, ∗p < 0.05, ∗∗p ≤ 0.01, ∗∗∗p < 0.001, ∗∗∗∗p < 0.0001. |
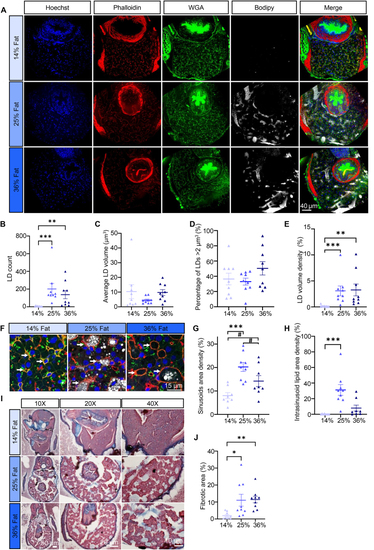
Intrahepatocellular lipids and fibrosis. (A) Representative images of liver sections in 21 dpf larvae. Nuclei stained with Hoechst (blue), actin stained with phalloidin (red), cell membranes stained with WGA (green), LDs stained with Bodipy665 (white). (B) LD count per fish. (C) Average LD volume per fish. (D) Percentage of LDs with a volume >2 μm3. (E) LD volume density. (F) Representative close view of liver tissue in 21 dpf larvae for each diet, white arrowheads are sinusoids. (G) Sinusoids area density. (H) Intrasinusoid lipid area density. (I) Representative Masson’s Trichrome images for each diet. (J) Fibrotic area. Bars represent mean ± SEM, n = 9 pooled from three independent experiments (For D: one-way ANOVA with Tukey HSD, for all others: Kruskal–Wallis test with Dunn’s multiple comparisons). For all panels: #p = 0.082, ∗p < 0.05, ∗∗p ≤ 0.01, ∗∗∗p < 0.001, ∗∗∗∗p < 0.0001. |
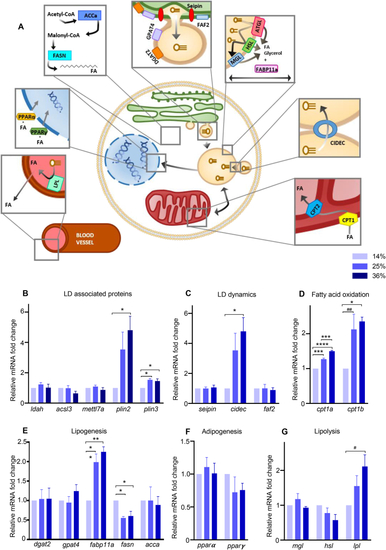
HFD altered lipid droplets associated pathways. (A) Schematic representation of target genes involved in LD coating proteins, dynamics, lipolysis, fatty acid oxidation, adipogenesis and lipogenesis. Lipoprotein lipase (lpl) hydrolyzes triglycerides and clears circulating lipids in the blood. Peroxisome proliferator-activated receptor α (pparα) and γ (pparγ) are transcription factors controlling lipid metabolism in various tissues. Acetyl-CoA carboxylase alpha (acca) catalyzes the carboxylation of acetyl-CoA to malonyl-CoA, which is then synthetized into long chains FA by the fatty acid synthase (fasn). Glycerol-3-phosphate acyltransferase 4 (gpat4) relocalizes from the endoplasmic reticulum (ER) to forming LDs and catalyzes the first step of triacylglycerol (TAG) synthesis. Diglyceride acyltransferase 2 (dgat2) is responsible for the conversion of diacylglycerol (DAG) to TAG. Fas associated factor family member 2 (faf2) and seipin are ER proteins which form budding LDs. Adipose triglyceride lipase (atgl), hormone-sensitive lipase (hsl), and monoacylglycerol lipase (mgl) are lipases which breakdown triglycerides stored in LDs. Fatty acid binding protein 11a (fabp11a) is involved in lipid transport, storage and breakdown. Cell death Inducing DFFA like effector c (cidec) is involved in LD fusion and growth as well as apoptosis, while perilipin 2 and 3 (plin), acyl-CoA synthetase 3 (acsl3), lipid droplet associated hydrolase (ldah) and methyltransferase like 7A (mettl7a) are recruited to LD during maturation. Carnitine O-palmitoyltransferase 1a (cpt1a) and b (cpt1b) transform lipids to allow degradation through β-oxidation by mitochondria. (B-G) Gene expression measured by RT-qPCR. Data are normalized with the alpha subunit of the elongation factor-1 complex (ef1α). Bars represent mean ± SEM, n = 3 pools of 25 larvae from three independent experiments (One way ANOVA with Tukey HSD). For all panels: #p = 0.0513, ##p = 0.0529, ∗p < 0.05, ∗∗p ≤ 0.01, ∗∗∗p < 0.001, ∗∗∗∗p < 0.0001. |