
FIGURE
Figure 3
- ID
- ZDB-FIG-230220-3
- Publication
- Grepper et al., 2023 - Methodological advancements in organ-specific ectopic lipid quantitative characterization: Effects of high fat diet on muscle and liver intracellular lipids
- Other Figures
- All Figure Page
- Back to All Figure Page
Figure 3
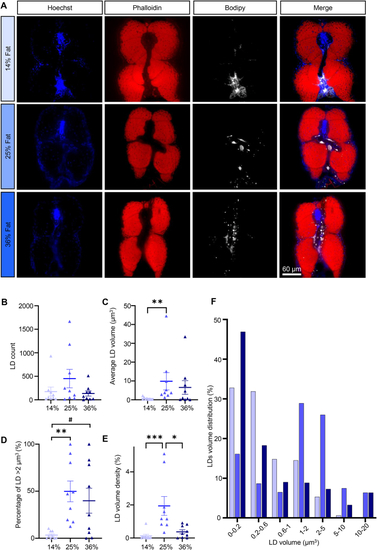
Intramyocellular lipids. (A) Representative images of skeletal muscle sections in 21 dpf larvae. Nuclei stained with Hoechst (blue), actin stained with phalloidin (red), LDs stained with Bodipy665 (white). (B) LD count per fish. (C) Average LD volume per fish. (D) Percentage of LDs with a volume >2 μm3. (E) LD volume density. (F) LD volume distribution. Bars represent mean ± SEM, n = 9 pooled from three independent experiments (Kruskal–Wallis test with Dunn’s multiple comparisons correction). For all panels: #p = 0.0586, ∗p < 0.05, ∗∗p ≤ 0.01, ∗∗∗p < 0.001, ∗∗∗∗p < 0.0001. |
Expression Data
Expression Detail
Antibody Labeling
Phenotype Data
Phenotype Detail
Acknowledgments
This image is the copyrighted work of the attributed author or publisher, and
ZFIN has permission only to display this image to its users.
Additional permissions should be obtained from the applicable author or publisher of the image.
Full text @ Mol Metab