
|
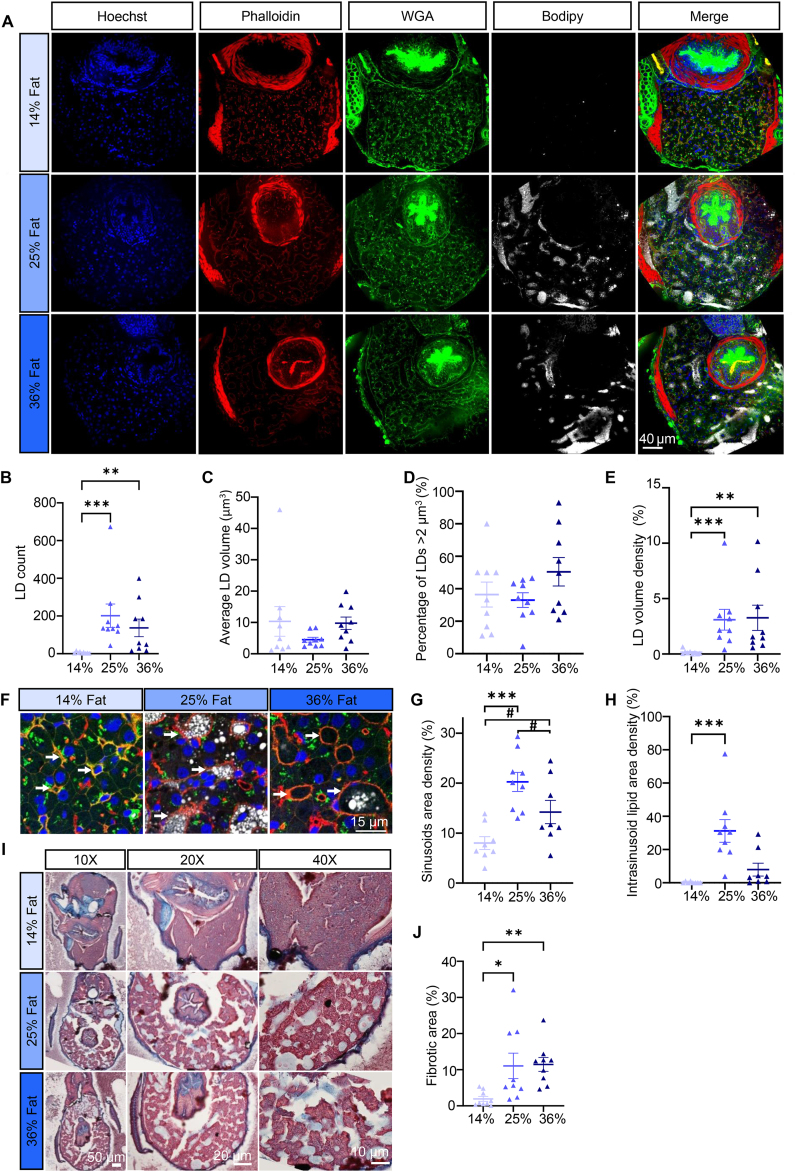
Figure 4
Intrahepatocellular lipids and fibrosis. (A) Representative images of liver sections in 21 dpf larvae. Nuclei stained with Hoechst (blue), actin stained with phalloidin (red), cell membranes stained with WGA (green), LDs stained with Bodipy665 (white). (B) LD count per fish. (C) Average LD volume per fish. (D) Percentage of LDs with a volume >2 μm3. (E) LD volume density. (F) Representative close view of liver tissue in 21 dpf larvae for each diet, white arrowheads are sinusoids. (G) Sinusoids area density. (H) Intrasinusoid lipid area density. (I) Representative Masson’s Trichrome images for each diet. (J) Fibrotic area. Bars represent mean ± SEM, n = 9 pooled from three independent experiments (For D: one-way ANOVA with Tukey HSD, for all others: Kruskal–Wallis test with Dunn’s multiple comparisons). For all panels: #p = 0.082, ∗p < 0.05, ∗∗p ≤ 0.01, ∗∗∗p < 0.001, ∗∗∗∗p < 0.0001.