
Figure 2
- ID
- ZDB-FIG-230220-2
- Publication
- Grepper et al., 2023 - Methodological advancements in organ-specific ectopic lipid quantitative characterization: Effects of high fat diet on muscle and liver intracellular lipids
- Other Figures
- All Figure Page
- Back to All Figure Page
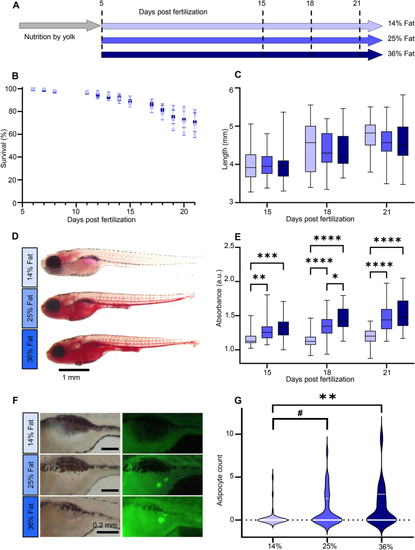
Study design and high fat diets validation. (A) Experimental design. Three cohorts of 50 larvae per group were studied at 15, 18 and 21 dpf. (B) Survival curve. Bars represent mean ± SEM. Starting n = 250 in three independent cohorts (3 × 3 ANOVA main effect of diet (F(2, 111) = 0.499, p = 0.609)). (C) Larvae length. Whiskers represent min. to max., n = 36 pooled from three independent cohorts (3 × 3 ANOVA main effect of diet (F(2, 317) = 1.628, p = 0.198)). (D) Representative Oil red O (ORO) images of 21 dpf larvae. (E) ORO extraction absorbance at 495 nm normalized to unstained samples. Whiskers represent min. to max., n = 36 per diet for each of the three independent experiments. (F) Representative Nile Red images of visceral adipocytes at 21 dpf. (G) Adipocyte count distribution per diet. Median and 75th quartile are shown by white lines, n = 33 per diet (Kruskal–Wallis test with Dunn’s multiple comparisons correction). For all panels: #p = 0.0525, ∗p < 0.05, ∗∗p ≤ 0.01, ∗∗∗p < 0.001, ∗∗∗∗p < 0.0001. |