
- Title
-
Loss of RREB1 in pancreatic beta cells reduces cellular insulin content and affects endocrine cell gene expression
- Authors
- Mattis, K.K., Krentz, N.A.J., Metzendorf, C., Abaitua, F., Spigelman, A.F., Sun, H., Ikle, J.M., Thaman, S., Rottner, A.K., Bautista, A., Mazzaferro, E., Perez-Alcantara, M., Manning Fox, J.E., Torres, J.M., Wesolowska-Andersen, A., Yu, G.Z., Mahajan, A., Larsson, A., MacDonald, P.E., Davies, B., den Hoed, M., Gloyn, A.L.
- Source
- Full text @ Diabetologia

Generation of the rreb1 loss-of-function zebrafish model. (a) Genomic structure of the zebrafish orthologues (rreb1a and rreb1b) of human RREB1 and the sites targeted by CRISPR/Cas9 in each gene. (b) Phylogenetic tree of human and zebrafish RREB1 proteins. Numbers on nodes are bootstrap values; the uniprot accession numbers of the sequences used are given after the species name. (c) Box and whisker plot of the percentage of embryonic/larval survival from day 1 to day 5 post fertilisation for the control group (NC) and rreb1a/b crispants based on data from six independent experiments (the number of larvae per experiment ranged from 188 to 308 24 h after microinjection; 1806 larvae in total). **p<0.01 (paired Student’s t test) PHENOTYPE:
|
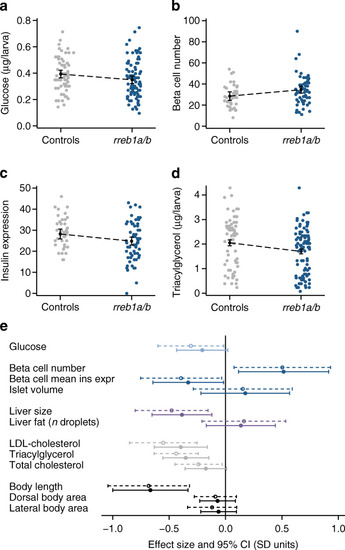
Effect of CRISPR/Cas9-induced mutations in zebrafish rreb1a and rreb1b on diabetes-related traits. (a–d) Individual-level data and margin plots for effects of mutations in rreb1a/b and kita (vs sibling controls targeted only at kita) on key traits with significant differences between the two groups, analysed using multiple linear regression analysis (p<0.05): (a) glucose levels, (b) beta cell number, (c) beta cell mean insulin expression (arbitrary units) and (d) triacylglycerol levels. Effects were adjusted for experiment, tank and time of day. Effects on glucose and triacylglycerol levels were additionally adjusted for imaging (yes/no) and for sample position and run. (e) Forest plot showing effect sizes and 95% CIs from multiple linear regression analysis for 10-day-old CRISPR/Cas9 founders with mutations in rreb1a/b and kita vs controls targeted only at kita. Dashed 95% CIs reflect results for crispants vs sibling controls only; solid 95% CIs show results including 536 additional controls from other experiments performed the same way. Adjustments are as described for Fig. 2a–d. Dorsal and lateral body area were additionally adjusted for length |

Partial loss of RREB1 reduces cellular insulin content in mature beta cells. (a) RREB1 gene expression (normalised to the housekeeping genes TBP and PPIA and expressed as % of siNT) in siNT control and siRREB1 knockdown EndoC-βH1 cells (n=3). (b) Representative western blot of RREB1 (250 kDa) and tubulin (50 kDa) in siNT and siRREB1 EndoC-βH1 cells. (c) Quantification of RREB1 protein expression following siRNA knockdown in EndoC-βH1 cells (n=6). (d) INS gene expression (normalised to the housekeeping genes TBP and PPIA and expressed as % of siNT) in siNT and siRREB1 EndoC-βH1 cells (n=5). (e) Cellular insulin content (pg/cell) (n=5) and (f) glucose-stimulated insulin secretion (pg/ml) (n=6; n=5 for siRREB1 16.7 mmol/l glucose) measured in siNT and siRREB1 EndoC-βH1 cells. Data are presented as means±SEM. *p<0.05, **p<0.01 (unpaired t test) |
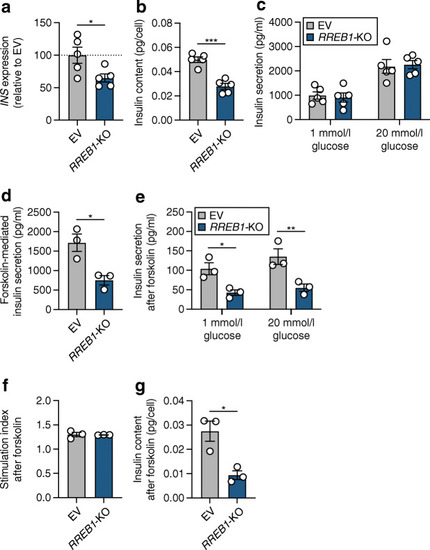
RREB1 knockout reduces cellular insulin content in mature beta cells. (a–c) RREB1 knockout (RREB1-KO) EndoC-βH1 cells were assessed for (a) INS gene expression (% of control cells [EV], normalised to housekeeping genes TBP and PPIA), (b) cellular insulin content (pg/cell) and (c) glucose-stimulated insulin secretion (pg/ml) (n=5). (d) Forskolin-mediated insulin secretion at 20 mmol/l glucose (pg/ml) (n=3). (e–g) After stimulation with forskolin, (e) glucose-stimulated insulin secretion (pg/ml), (f) the stimulation index and (g) insulin content (pg/cell) were measured (n=3). Data are presented as means±SEM. *p<0.05, **p<0.01, p***<0.001 (a, b, d, unpaired t test; c, e, two-way ANOVA followed by Sidak’s multiple comparisons test) |
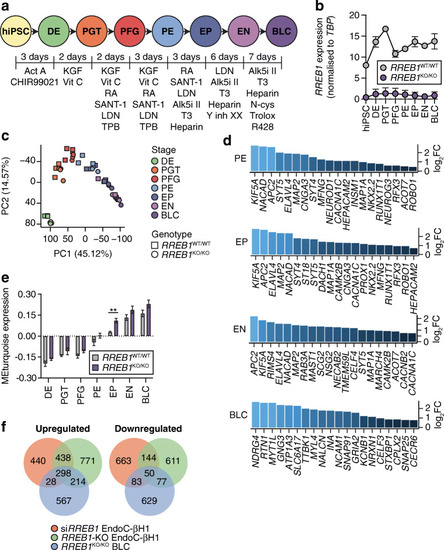
Transcriptomic analysis reveals altered expression of pro-endocrine genes following loss of RREB1 in human beta cells. (a) Schematic of the in vitro differentiation protocol stages: definitive endoderm (DE) cells, primitive gut tube (PGT) cells, posterior foregut (PFG) cells, pancreatic endoderm (PE) cells, endocrine progenitor (EP) cells, endocrine (EN) cells and BLCs. Growth factors and small molecules (listed underneath each stage) were added for the indicated amounts of time. (b) RREB1 expression in RREB1WT/WT (n=3) and RREB1KO/KO (n=4) hiPSC cell lines during in vitro differentiation towards BLCs. (c) The first two principal components (PC1, PC2) were calculated using normalised gene counts of RREB1KO/KO (circles; n=4) and RREB1WT/WT (squares; n=3) cell lines for all seven stages of in vitro beta cell differentiation. (d) Differential expression of endocrine cell genes in PE cells, EP cells, EN cells and BLCs. (e) Analysis of modules of co-expressed genes using WGCNA: bar plot showing module epigengene (ME) expression of the module enriched for endocrine progenitor and endocrine genes. (f) Venn diagrams of the overlap of DEGs between siRREB1 knockdown EndoC-βH1 cells, RREB1-KO EndoC-βH1 cells and hiPSC-derived RREB1KO/KO BLCs. Data are presented as means±SEM. **p<0.01 (unpaired t test). Act A, activin A; Alk5i II, ALK5 inhibitor II; CHIR99021, GSK-3 inhibitor; KGF, keratinocyte growth factor; LDN, LDN193189 BMP type 1 receptor inhibitor; N-cys, N-acetyl cysteine; R428, AXL inhibitor; RA, retinoic acid; SANT-1, hedgehog signalling inhibitor; T3, triiodothyronine; TPB, PKC activator; Trolox, vitamin E; Y inh XX, gamma secretase inhibitor; Vit C, vitamin C |
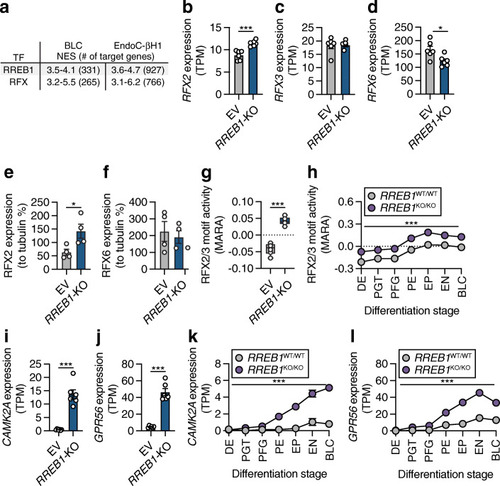
RREB1 deficiency affects RFX motif activity. (a) Most common transcription factor (TF) motifs in hiPSC-derived BLCs and EndoC-βH1 cells of 9713 position weight matrices and 1120 ENCODE ChIP-Seq tracks (centred 10kb around a transcription start site) tested. NES, normalised enrichment score with cut-off set to >3 (corresponding to a false discovery rate of 3–9%); # of target genes, number of target genes for the TF motif with the highest NES. (b–d) Expression of (b) RFX2, (c) RFX3 and (d) RFX6 mRNA in transcripts per millions (TPM) in EV and RREB1-KO EndoC-βH1 cells (n=6). (e, f) Protein quantification of (e) RFX2 and (f) RFX6 in RREB1-deficient cells (n=4). (g, h) RFX2/3 motif activities in (g) EV and RREB1-KO EndoC-βH1 cells (n=6) and (h) RREB1WT/WT (n=3) and RREB1KO/KO (n=4) cells during hiPSC differentiation to BLCs calculated using MARA. (i, j) Expression of the RFX2/3 target genes (i) CAMK2A and (j) GPR56 in EV and RREB1-KO EndoC-βH1 cells (n=6). (k, l) Expression of the RFX2/3 target genes (k) CAMK2A and (l) GPR56 in RREB1WT/WT (n=3) and RREB1KO/KO (n=4) cells during in vitro differentiation to BLCs. Data are presented as means±SEM. *p<0.05, ***p<0.001 (unpaired t test) |

RREB1 deficiency in EndoC-βH1 cells alters gene expression of RFX family members. (a) RFX2 protein quantification (normalised to tubulin and relative to EV siNT) in EV (n=4) and RREB1-KO (n=4) EndoC-βH1 cells following siNT and siRFX2 transfection. (b, c) Gene expression of (b) CAMK2A (n=4) and (c) GPR56 (n=3) (normalised to the housekeeping genes TBP and PPIA and relative to siNT) in EV and RREB1-KO EndoC-βH1 cells following siRNA-mediated depletion of RFX2. (d) RFX3 protein quantification (normalised to tubulin and relative to EV siNT) in EV (n=4) and RREB1-KO (n=4) EndoC-βH1 cells following siNT and siRFX3 transfection. (e, f) Gene expression of (e) CAMK2A (n=4) and (f) GPR56 (n=3) (normalised to the housekeeping genes TBP and PPIA and relative to siNT) in EV and RREB1-KO EndoC-βH1 cells following siRNA-mediated deletion of RFX3. (g, h) Gene expression of (g) RFX2 (EV, n=5; RREB1-KO, n=4) and (h) RFX3 (n=4) (normalised to the housekeeping gene TBP and relative to siNT) in EV and RREB1-KO EndoC-βH1 cells following siRNA-mediated knockdown of RFX2, RFX3 or RFX2 and RFX3. (i, j) Gene expression of (i) CAMK2A and (j) GPR56 (normalised to the housekeeping gene TBP and relative to siNT) in EV (n=5) and RREB1-KO (n=4) EndoC-βH1 cells following single or dual knockdown of RFX2 and RFX3. Data are presented as means±SEM. *p<0.05, **p<0.01, ***p<0.001 (a–f, unpaired t test; g–j, unpaired t test with Welch’s correction) |
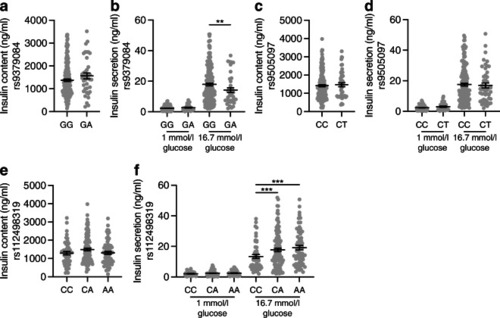
Genetic variation at the RREB1 locus influences human beta cell function. Insulin content (a, c, e) and glucose-stimulated insulin secretion (b, d, f) in human donor islets from carriers of RREB1 variants: (a, b) rs9379084 (GG, n=180; GA, n=38), (c, d) rs9505097 (CC, n=168; CT, n=219) and (e, f) rs112498319 (CC, n=50; CA, n=109; CC, n=50). Data are presented as means±SEM. **p<0.01, ***p<0.001 (one-way ANOVA) |