
Fig. 7
- ID
- ZDB-IMAGE-230228-430
- Publication
- Mattis et al., 2023 - Loss of RREB1 in pancreatic beta cells reduces cellular insulin content and affects endocrine cell gene expression
- All Figures
- Figures for Mattis et al., 2023
|
Fig. 7
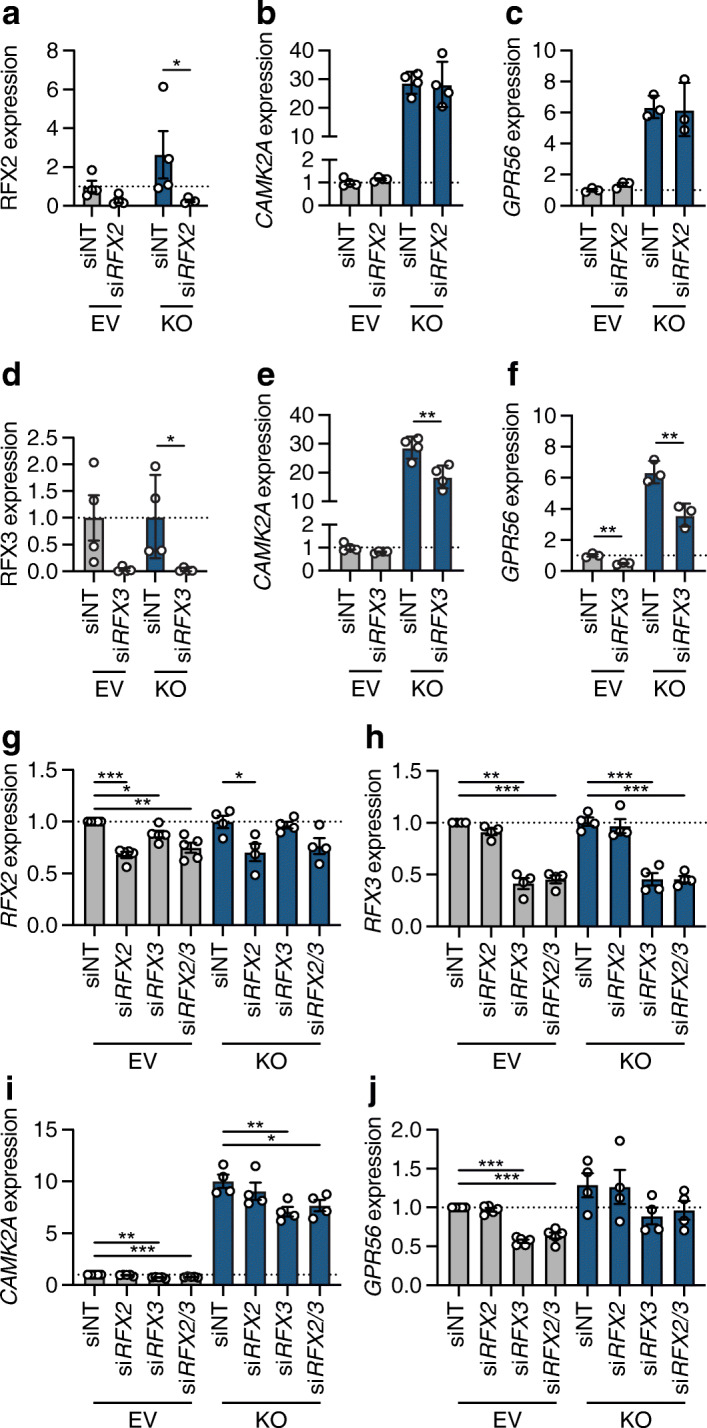
RREB1 deficiency in EndoC-βH1 cells alters gene expression of RFX family members. (a) RFX2 protein quantification (normalised to tubulin and relative to EV siNT) in EV (n=4) and RREB1-KO (n=4) EndoC-βH1 cells following siNT and siRFX2 transfection. (b, c) Gene expression of (b) CAMK2A (n=4) and (c) GPR56 (n=3) (normalised to the housekeeping genes TBP and PPIA and relative to siNT) in EV and RREB1-KO EndoC-βH1 cells following siRNA-mediated depletion of RFX2. (d) RFX3 protein quantification (normalised to tubulin and relative to EV siNT) in EV (n=4) and RREB1-KO (n=4) EndoC-βH1 cells following siNT and siRFX3 transfection. (e, f) Gene expression of (e) CAMK2A (n=4) and (f) GPR56 (n=3) (normalised to the housekeeping genes TBP and PPIA and relative to siNT) in EV and RREB1-KO EndoC-βH1 cells following siRNA-mediated deletion of RFX3. (g, h) Gene expression of (g) RFX2 (EV, n=5; RREB1-KO, n=4) and (h) RFX3 (n=4) (normalised to the housekeeping gene TBP and relative to siNT) in EV and RREB1-KO EndoC-βH1 cells following siRNA-mediated knockdown of RFX2, RFX3 or RFX2 and RFX3. (i, j) Gene expression of (i) CAMK2A and (j) GPR56 (normalised to the housekeeping gene TBP and relative to siNT) in EV (n=5) and RREB1-KO (n=4) EndoC-βH1 cells following single or dual knockdown of RFX2 and RFX3. Data are presented as means±SEM. *p<0.05, **p<0.01, ***p<0.001 (a–f, unpaired t test; g–j, unpaired t test with Welch’s correction)