
Fig. 6
- ID
- ZDB-FIG-230228-434
- Publication
- Mattis et al., 2023 - Loss of RREB1 in pancreatic beta cells reduces cellular insulin content and affects endocrine cell gene expression
- Other Figures
- All Figure Page
- Back to All Figure Page
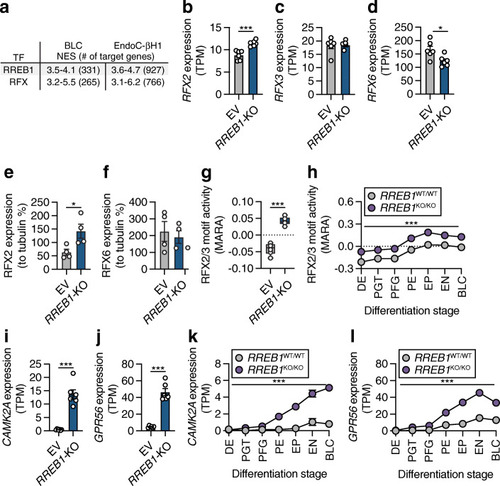
RREB1 deficiency affects RFX motif activity. (a) Most common transcription factor (TF) motifs in hiPSC-derived BLCs and EndoC-βH1 cells of 9713 position weight matrices and 1120 ENCODE ChIP-Seq tracks (centred 10kb around a transcription start site) tested. NES, normalised enrichment score with cut-off set to >3 (corresponding to a false discovery rate of 3–9%); # of target genes, number of target genes for the TF motif with the highest NES. (b–d) Expression of (b) RFX2, (c) RFX3 and (d) RFX6 mRNA in transcripts per millions (TPM) in EV and RREB1-KO EndoC-βH1 cells (n=6). (e, f) Protein quantification of (e) RFX2 and (f) RFX6 in RREB1-deficient cells (n=4). (g, h) RFX2/3 motif activities in (g) EV and RREB1-KO EndoC-βH1 cells (n=6) and (h) RREB1WT/WT (n=3) and RREB1KO/KO (n=4) cells during hiPSC differentiation to BLCs calculated using MARA. (i, j) Expression of the RFX2/3 target genes (i) CAMK2A and (j) GPR56 in EV and RREB1-KO EndoC-βH1 cells (n=6). (k, l) Expression of the RFX2/3 target genes (k) CAMK2A and (l) GPR56 in RREB1WT/WT (n=3) and RREB1KO/KO (n=4) cells during in vitro differentiation to BLCs. Data are presented as means±SEM. *p<0.05, ***p<0.001 (unpaired t test) |