
Fig. 1
- ID
- ZDB-IMAGE-230228-429
- Publication
- Mattis et al., 2023 - Loss of RREB1 in pancreatic beta cells reduces cellular insulin content and affects endocrine cell gene expression
- All Figures
- Figures for Mattis et al., 2023
|
Fig. 1
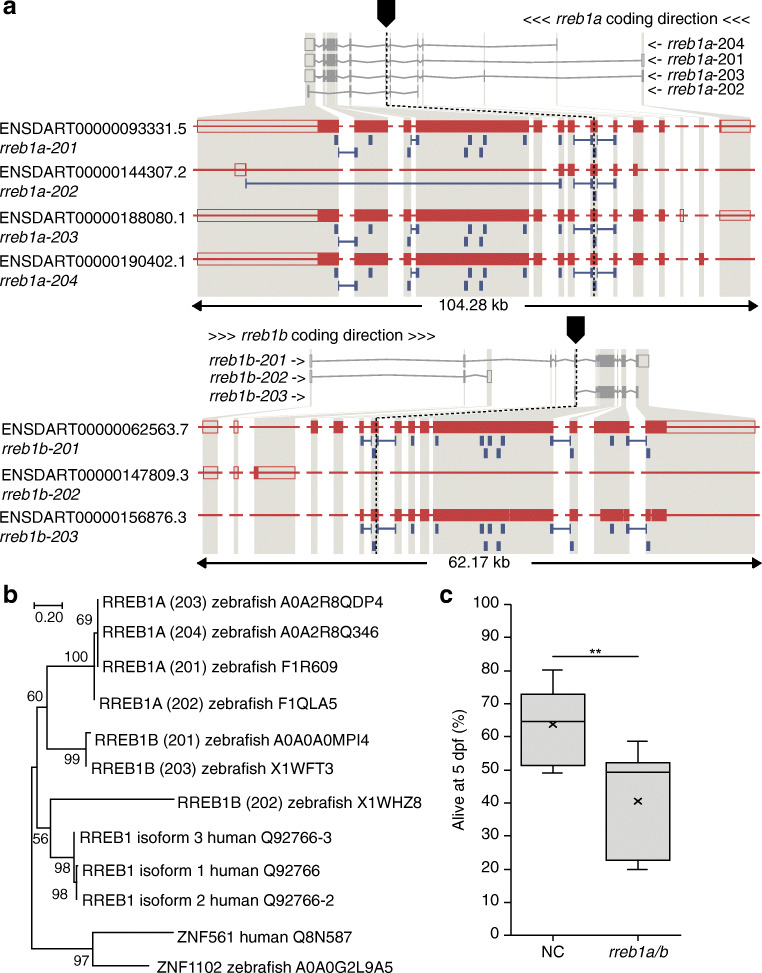
Generation of the rreb1 loss-of-function zebrafish model. (a) Genomic structure of the zebrafish orthologues (rreb1a and rreb1b) of human RREB1 and the sites targeted by CRISPR/Cas9 in each gene. (b) Phylogenetic tree of human and zebrafish RREB1 proteins. Numbers on nodes are bootstrap values; the uniprot accession numbers of the sequences used are given after the species name. (c) Box and whisker plot of the percentage of embryonic/larval survival from day 1 to day 5 post fertilisation for the control group (NC) and rreb1a/b crispants based on data from six independent experiments (the number of larvae per experiment ranged from 188 to 308 24 h after microinjection; 1806 larvae in total). **p<0.01 (paired Student’s t test)