
- Title
-
shox2 is required for vestibular statoacoustic neuron development
- Authors
- Laureano, A.S., Flaherty, K., Hinman, A.M., Jadali, A., Nakamura, T., Higashijima, S.I., Sabaawy, H.E., Kwan, K.Y.
- Source
- Full text @ Biol. Open

Generating shox2 mutant zebrafish. (A) Genomic representation of wild-type shox2 (shox2+) gene containing five exons (E1-5), 5′ and 3′ untranslated regions (UTRs). Black lines above exons 2 and 3 demarcate the coding region for the homeobox domain. The blue line above exon 5 marks the otp, aristaless, and rax (OAR) domain. Black arrows represent the approximate primer binding sites utilized for PCR genotyping of shox2+. The shox2 null allele was generated using two CRISPR/Cas9 sgRNAs complexes that bind and cleave in exons 1 and 2. Repair and joining of the two cut sites deleted genomic DNA containing parts of exon1 and 2 to create the shox2 null allele (shox2Δ). Red arrows denote the approximate binding site of primer pairs for PCR genotyping of shox2Δ. (B) shox2Δ (Δ) and shox2+ (+) PCR products using DNA obtained from shox2+/+,shox2Δ/+, and shox2Δ/Δ embryos. (C) Quantification of shox2 transcript levels by RT-qPCR. shox2+/+ (1.00±.08; n=11), shox2Δ/+ (0.59±0.05; n=8) and shox2Δ/Δ (0.0003±0.0001; n=11) embryos. Each dot represents data from an individual embryo at 24 hpf. (D) Section of the otic placode in 18 somite stage embryos after in situ hybridization with shox2 probe in shox2+/+ and shox2Δ/Δ embryos. Whole-mount immunofluorescence labeling of Shox2 on 24 hpf embryos from (E) shox2+/+, (F) shox2Δ/+ and (G) shox2Δ/Δ larva in the Tg(pax2a: GFP) reporter background. Fluorescent images from Tg (pax2a: GFP) (green) reporter, Shox2 (red) immunostaining, merged image with Hoechst (blue). Magnified images show optical sections of merged images. Arrows point to the diencephalic region with Shox2 expression. Optical sections of the region flanked by d1 and d2 containing nuclear Shox2 labeling were used for fluorescence quantification. (H) Shox2 immunofluorescence signal from individual cells taken from shox2+/+ (3544±44.8 a.u., n=965 cells, 12 embryos), shox2Δ/a (2279±32.1 a.u., n= 687 cells, ten embryos) and shox2Δ/Δ (744.9±4.9 a.u., n=885 cells, 11 embryos). A threshold of two standard deviation above average background signal (1053 a.u.) was set (dotted line). Cells above the threshold were considered Shox2 positive and used for comparison. (I) Percent of Shox2 expressing cells in cohort in shox2+/+ (95.3±1.6%), shox2Δ/a (83.2±3.9%) and shox2Δ/Δ (1.95±1.0%) larvae. Cell and embryo numbers as listed above. One-way ANOVA and Sidak multiple comparisons tests were used for statistical analysis. Values reported as mean±s.e.m. **P≤0.01, ***P≤ 0.001; ****P≤ 0.0001. d1-d2; diencephalic domain 1 and 2; MBH, mid hindbrain boundary; a.u., arbitrary units, s.e.m. standard error of the mean. Scale bars: 10 µm. EXPRESSION / LABELING:
PHENOTYPE:
|

Analyzing vestibular and auditory behavior of shox2 mutant larvae. (A) Representative images of shox2+/+ and shox2Δ/Δ 5 dpf zebrafish larvae. The arrow points to the swim bladder (SB). (B) Percent of embryos with inflated swim bladder at different ages in shox2+/+ (4 dpf: 72.4±13.6%, 5 dpf: 87.5±9.2%, 6 dpf: 92.6±4.4%, 7 dpf: 95.0±5.1%), and shox2Δ/Δ (4 dpf: 19.1±8.4%, 5 dpf: 23.4±6.5%, 6 dpf: 21.9±7.7%, 7 dpf: 24.3±9.9%) larvae. (C) Percent of shox2+/+ (82.7±2.8%, n=42) and shox2Δ/Δ (70.3±4.0%, n=37) larva passing the balance test (BT), embryos from different ages were combined. (D) Average distance traveled by shox2+/+ (4 dpf: 1.4±0.3 cm, 5 dpf: 3.4±0.6 cm, 6 dpf: 2.8±0.4 cm, 7 dpf: 3.4±0.5 cm) or shox2Δ/Δ (4 dpf: 2.8±0.7 cm, 5 dpf: 7.2±2.0 cm, 6 dpf: 5.6±1.0 cm, 7 dpf: 4.9±1.4 cm) larva after mechanical stimulation. (E) Percent of embryos responding to a series of tone pip in shox2+/+ (n=15) and shox2Δ/Δ (n=22) larvae. Tone bursts were presented at 0.1, 0.2, 0.3, 0.5 and 1 kHz and movements evoked from acoustic stimuli were recorded. Three independent trials were accomplished for each frequency and showed no significant (ns) differences. One-way ANOVA and Sidak multiple comparisons tests were used for statistical analysis. Values reported as mean±s.e.m. P≤0.05, **P≤0.01, ***P≤ 0.001; ****P≤ 0.0001. Values reported as mean±s.e.m. |
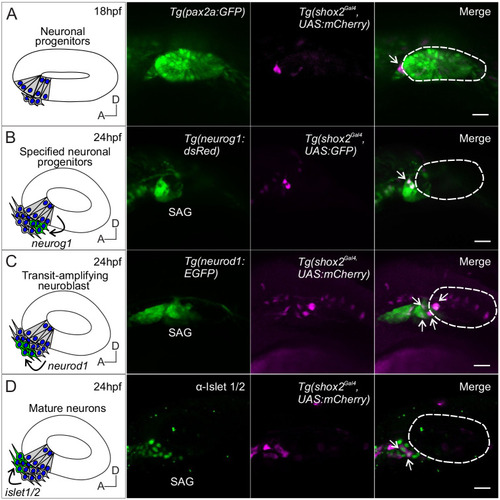
Lineage labeling of neurogenic cells in the developing SAG using shox2 fluorescent reporter. Fluorescent images of developing inner ear from Tg(shox2Gal4,UAS:GFP) reporter larva with inner ear and neuronal reporters. Curved arrows on diagrams indicate migration of developing neurons from its previous locations. Dashed lines in merged images outline the otic vesicle. (A) Diagram of neuronal progenitors in the anteroventral region of the otic vesicle at 18 hpf. Reporter fluorescence from a pan-otic Tg(pax2a: GFP) and Tg (shox2Gal4,UAS:mCherry) at 18 hpf. Merged image depicts shox2 reporter labeled cells (arrow) in the anteroventral region adjacent to the otic vesicle (n= 5). (B) Diagram of delaminating neuroblasts expressing neurog1 (green) at the floor of the otic vesicle. Fluorescence from Tg(neurog1: dsRed) and Tg(shox2Gal4,UAS:GFP) reporters at 24 hpf. Merged image identifies specified neuroblasts and delaminating neuroblasts (arrows) (n=14 embryos). (C) Diagram of transit-amplifying neuroblasts expressing neurod1 (green) at 24 hpf after delaminating from the otic vesicle. Fluorescence from TgBAC(neurod1: EGFP) and Tg(shox2Gal4,UAS:mCherry) reporters at 24 hpf. Merged image shows overlap of neurod1 and shox2 reporter fluorescence (arrows) (n=9 embryos). (D) Diagram of mature neurons expressing Islet 1/2 (green) from transit amplifying neuroblasts (arrow). Fluorescence from the medial position of the neurogenic domain shows Islet 1/2 immunostaining and Tg(shox2Gal4, UAS:mCherry) reporter at 24 hpf. Merged image shows overlap of Islet 1/2 and shox2 reporter marked cells (arrow) (n= 11 embryos). SAG, statoacoustic ganglion. Scale bars: 10 µm. EXPRESSION / LABELING:
|

Comparing number of SAG between shox2+/+ and shox2Δ/Δ animals. HuC/D immunostaining of shox2+/+ and shox2Δ/Δ larvae that contain the Tg(neurod1: EGFP) reporter at (A) 2, (B) 3 and (C) 5 dpf. EGFP (green) and HuC/D (magenta) are shown. Asterisks mark the anterior SAG (aSAG). (D) HuC/D cell counts from aSAG are as follows: 2 dpf, shox2+/+ (55.7±3.0 cells, n=12 larvae), shox2Δ/Δ (51.2±2.4 cells, n=11 larvae), 3 dpf, shox2+/+ (66.4±3.1 cells, n=10 larvae), shox2Δ/Δ (56.1±3.1 cells, n=11 larvae), 5 dpf, shox2+/+ (63.2±1.8 cells, n=11 larvae), shox2Δ/Δ (55.1±2.1 cells, n=12 larvae). (E) HuC/D cell counts from posteromedial SAG (pSAG) are as follows: 2 dpf, shox2+/+ (39.5±1.9 cells, n=15 larvae), shox2Δ/Δ (39.1±1.8 cells, n=14 larvae), 3 dpf, shox2+/+ (38.9±3.8 cells, n=10 larvae), shox2Δ/Δ (43.9±1.9 cells, n=11 larvae), 5 dpf, shox2+/+ (58.6±3.7 cells, n=13 larvae), shox2Δ/Δ (55.4±4.3 cells, n=14 larvae). One-way ANOVA and Sidak multiple comparison test were used. *P≤0.05, **P≤0.01. Values reported as mean±s.e.m. Scale bars: 10 µm. |

Comparing number of hair cells between shox2+/+ and shox2Δ/Δ animals. (A) Diagram depicting the developing sensory domain (gray) in the inner ear at 24-25 hpf with developing hair cells expressing otoferlin a and b (otof a/b) in the anterior macula (AM) and posterior macula (PM). Fluorescent images of Tg (shox2Gal4, UAS:mCherry) reporter with HCS1 antibody immunofluorescence labeling at 24-25 hpf. The HCS-1 antibody recognizes Otoferlin. The merged image depicts shox2 reporter labeled cells (arrows) within the OV (otic vesicle) in the anteroventral region (n=9 embryos). Dashed lines mark the otic vesicle. Whole-mount HCS-1 immunolabeling of hair cells from the AM and PM in shox2+/+ and shox2Δ/Δ larvae at (B) 2, (C) 3 and (D) 5 dpf were acquired for quantification. (E) HCS-1 cell counts from the AM are as follows: 2 dpf, shox2+/+ (12.9±0.8 cells, n=18 larvae), shox2Δ/Δ (12.8±1.0 cells, n=18 larvae), 3 dpf, shox2+/+ (28.3±1.6 cells, n=12 larvae), shox2Δ/Δ (20.7±1.5 cells, n=13 larvae), 5 dpf, shox2+/+ (57.2±1.8 cells, n=16 larvae), shox2Δ/Δ (55.2±1.8 cells, n=15 larvae). (F) HCS-1 cell counts from the PM are as follows: 2 dpf, shox2+/+ (18.7±1.3 cells, n=13 larvae), shox2Δ/Δ (18.9±1.0 cells, n=13 larvae), 3 dpf, shox2+/+ (41.6±1.2 cells, n=12 larvae), shox2Δ/Δ (37.3±2.1 cells, n=12 larvae), 5 dpf, shox2+/+ (87.1±3.2 cells, n=19), shox2Δ/Δ (80.0±2.9 cells, n=20 larvae). One-way ANOVA and Sidak multiple comparison test were used. **P≤0.01. Values reported as mean±s.e.m. Scale bars: 10 µm. |

Identifying cell populations in shox2+/+ and shox2Δ/Δ embryos by single cell RNA-seq. (A) shox2+/+ (n=59 embryos) and shox2Δ/Δ embryos (n=43 embryos) at 16-22 hpf were harvested and tissue around the otic vesicle microdissected. Samples of the same genotype were pooled and subjected to scRNA-seq. Transcriptome of individual cells were aggregated, dimensionality reduction performed followed by unsupervised clustering before visualizing as a UMAP projection. Course-grain visualization of 29,152 cells identified 28 distinct cell types after clustering. (B) Cells from shox2+/+ (magenta) and shox2Δ/Δ (green) were identified using by library barcodes to display different and common cell populations. Major differences between wild-type and mutant cell populations were marked by single or double asterisks respectively. (C) sox2 highlight progenitor cells while elavl3 mark developing neurons. (D) neurog1 and neruod1 identify neuronal progenitors and developing neurons. (E) Cells expressing dsRed and EGFP from transgenes introduced into shox2+/+ embryos. Cell clusters identified from graph-based clustering that overlapped with dsRed and EGFP in shox2+/+ and shox2Δ/Δ were used to identify progenitors and developing neurons. (F) Plot of progenitor and development obtained from identified subset of cell clusters were obtained for further analysis. Progenitor and developing neuron populations from shox2+/+ (magenta) and shox2Δ/Δ (green) cells were identified using library identification barcodes for each genotype. (G) Sub-population of cells express sox2 and elavl3 to mark progenitor and developing neurons, respectively. (H) Sub- population of cells express neurog1 and neruod1 to mark neuronal progenitors and developing neurons, respectively. |

Identifying progenitor populations from shox2+/+ and shox2Δ/Δ embryos. Cell clusters that correspond to progenitors from the course-grain map were bioinformatically extracted and reanalyzed by unsupervised clustering before visualizing on UMAP coordinates. (A) Plot of progenitor populations from shox2+/+ (magenta) and shox2Δ/Δ (green) cells were identified using library identification barcode for each cell type. (B) Fine-grain UMAP plot shows 12 distinct cell clusters labeled from 0-11. shox2+/+ clusters are labeled in black and shox2Δ/Δ in red numerals. Dot plots were used to display marker gene expression. Each dot represents two values, the color of the dot represents relative gene expression levels and the size of the dot represents the percentage of cells expressing the gene. Hierarchical clustering identified related cell populations and the dendrogram represents the relationship between cell clusters. shox2+/+ and shox2Δ/Δ cell clusters are marked by black and red numbers, respectively. (C) Identifying otic progenitor (op) population that express inner ear marker genes (oc90, six1a, six1b, eya1 and neurog1) were used to identify wild-type otic progenitor population. Hierarchical clustering revealed otic progenitors from wild-type and mutant cells that are highlighted by a blue box. (D) Identifying rhombomere cell populations expressing different hox genes (hoxa2b, hox2a, egr2a, egr2b, hoxb1a, hox1b, hoxb3a, hoxa4a and hoxd4a). Cell clusters were subjected to hierarchical clustering to identify cells from rhombomere (r) 5, 6 and 7. Cell populations from wild-type and mutant cells that are shaded in purple, red and green. (E) Expression of otic and developing rhombomere marker genes in progenitor populations. Dendrogram displays the relationship between clusters. Otic progenitor cluster are highlighted in blue, rhombomere 5, 6 and 7 clusters are highlighted in purple, red and green box, respectively. |
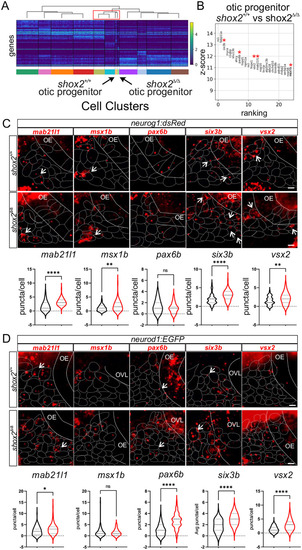
Determining differential gene expression between shox2+/+ and shox2Δ/Δ otic progenitors and developing neurons. (A) Heat map displaying transcript levels of the fifty variable genes for individual cells from each cluster identified in the progenitor population. Cells from each cluster is marked by a different color rectangle at the bottom of the heatmap. Arrows point to otic progenitor populations from shox2+/+ and shox2Δ/Δ embryos. Dendrogram displays the similarity and relationship between cell populations. (B) Differential expression analysis of genes from shox2+/+ otic progenitors with shox2Δ/Δ mutant otic progenitor. The z-score associated with each gene represents the number of standard deviation away from the mean gene transcript levels between shox2+/+ and shox2Δ/Δ cells. The ranking of significantly altered genes is based on the z-score. Red asterisks denote transcripts that are subjected to smFISH. smFISH using mab21l1, msx1b, pax6b, six3b and vsx2 probes was performed on 24 hpf shox2+/+ and shox2Δ/Δ embryos in (C) TgBAC(neurog1:dsRed) or (D) TgBAC(neurod1:EGFP) larvae. For TgBAC(neurog1:dsRed) lines, the following number of embryos were used for each smFISH probe: mab21l1 (shox2+/+, n=15; shox2Δ/Δ, n=12), msx1b, (shox2+/+, n=15; shox2Δ/Δ, n=13), pax6b (shox2+/+, n=15; shox2Δ/Δ, n=13), six3b (shox2+/+, n=14; shox2Δ/Δ, n=13) and vsx2 (shox2+/+, n=15; shox2Δ/Δ, n=12). For TgBAC(neurod1:EGFP) lines, the following number of embryos were used for each smFISH probe: mab21l1 (shox2+/+, n=13; shox2Δ/Δ, n=12), msx1b, (shox2+/+, n=15; shox2Δ/Δ, n=12), pax6b (shox2+/+, n=15; shox2Δ/Δ, n=13), six3b (shox2+/+, n=15; shox2Δ/Δ, n=13) and vsx2 (shox2+/+, n=15; shox2Δ/Δ, n=12). Quantification of puncta per cell from whole-mount zebrafish at 24 hpf in dsRed or EGFP marked cells displayed as violin plots from shox2+/+ (black) and shox2Δ/Δ (red) embryos. Solid lines mark the otic epithelium (OE) and otic vesicle lumen (OVL) in the images, while dashed lines outline cells expressing the fluorescent transgenes. Values reported (mean±s.e.m.). Statistical tests were performed on the number or larvae from each sample using Welch's t-test. n.s. (not significant), *P≤0.05, **P≤0.01, ****P≤ 0.0001. Scale bars: 10 µm. |
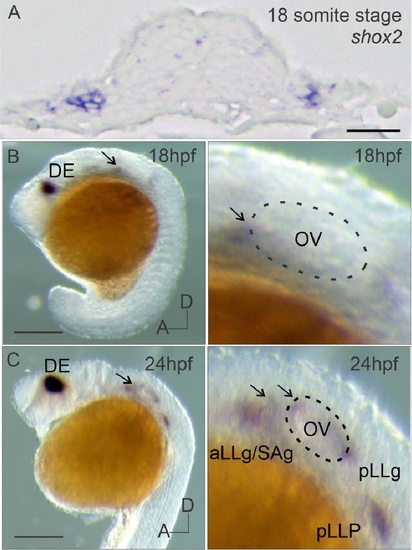
In situ hybridization of shox2 transcript in the developing zebrafish inner ear (A) shox2 in situ hybridization signal in a section of 18 somite stage (~16 hpf) embryo across the otic placode. Lateral view of whole mount shox2 in situ hybridization signal in zebrafish embryos (left panels) with magnified images of the otic vesicle region (right panels) at (B) 18 and (C) 24 hpf. Arrows point to the anterior ventral region of the otic vesicle. The dashed line in magnified images marks the otic vesicle (18,24 hpf). OV (otic vesicle), DE (diencephalon), aLLG (anterior lateral line ganglia), SAG (statoacoustic ganglion) pLLG (posterior lateral line ganglia) and posterior lateral line primordium (pLLP) are depicted. Anterior (A) and dorsal (D) axis for embryos are labeled. Scale bar: 50 µm. EXPRESSION / LABELING:
|
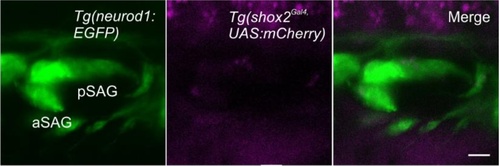
Lineage labeling in developing statoacoustic ganglion at 48 hpf using shox2 fluorescent reporters. Fluorescent images of developing inner ear from larvae containing Tg(shox2Gal4,UAS:mCherry) (magenta) and Tg(neurod1: EGFP) (green) neuronal reporter at 48 hpf. Merged image shows no shox2 reporter labeled cells in either anterior or posterior statoacoustic ganglion neurons (n= 5). EXPRESSION / LABELING:
|