
- Title
-
Small Molecule-mediated Disruption of Ribosome Biogenesis Synergizes With FGFR Inhibitors to Suppress Glioma Cell Growth
- Authors
- Zisi, A., Kanellis, D.C., Moussaud, S., Karlsson, I., Carén, H., Bräutigam, L., Bartek, J., Lindström, M.S.
- Source
- Full text @ Neuro Oncol.
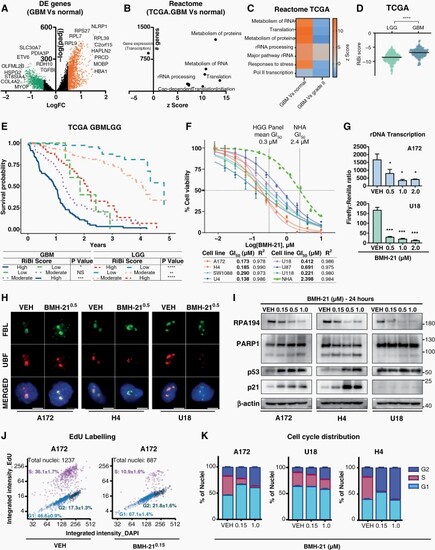
RiBi is a relevant target for high-grade gliomas. (A) Differential expression (DE) analysis of RNAseq data between GBM (TCGA) and normal samples, with downregulated/green and upregulated/orange genes (log2FC > 0.5, padj < 0.05). (B) Reactome pathway enrichment analysis of DE genes from (A). z-score shows the tendency of genes within a term to be up/downregulated. (C) DE genes z-score-heatmap among GBM-normal or stages II to IV samples. (D) RiBi score and glioma grading association in TCGA cohort. (E) Kaplan–Mayer plot showing survival advantage of low versus moderate and high RiBi GBMLGG patients in TCGA. (F) BMH-21 dose–response (72 h) in normal human astrocytes (NHA) and glioma cell lines, with corresponding GI50 values (G) rDNA transcription in A172 and U18, quantified using an rRNA-promoter reporter assay. (H) Representative immunofluorescence images of nucleolar proteins FBL and UBF in glioma cells. Nuclei are counterstained with DAPI. Scale bar, 10 μm. (I) Indicated protein levels in glioma cells; beta-actin served as loading control (J–K) Click-it EdU-based cell-cycle analysis representative dot plots (J) and stacked barplot (K) of cell-cycle distribution into G1, S, and G2. |
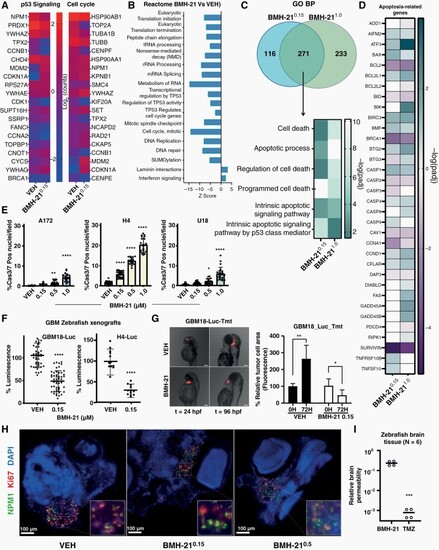
BMH-21 induces glioma cell death and suppresses glioma cell growth in zebrafish model. (A) Heatmaps showing the most significant DE genes corresponding to Reactome terms p53-Signaling (left) and Cell Cycle (right) following indicated 24 h-treatments (μM). (B) Reactome PE analysis in DE genes (g: Profiler). (C) Venn diagram comparing GO-BP ontology terms among BMH-210.15 and BMH-211.0 (padj < 0.05) corresponding to cell death-related signatures. (D) Heatmap shows commonly enriched terms and gene perturbations corresponding to apoptotic signatures among BMH-21 concentrations. (E) Quantification of Cas3/7-positive nuclei (48h-treatment). (F) Quantification of the luminescent signal emitted from injected zebrafish embryo lysates (72h-treatment). VEH mean signal intensity = 100% luminescence. (G) representative images and area quantification of fluorescent tumor cell transplants 24 and 96 hpf. (H) Immunofluorescence images of zebrafish cryosections (72 h-treatment, stained for Ki67 and NPM1). Insets depict magnifications of the designated regions. Scale bar 100 μm. (I) Relative BMH-21 and TMZ quantification in dissected zebrafish brains following 4 h-treatment, suggesting BBB permeability. |
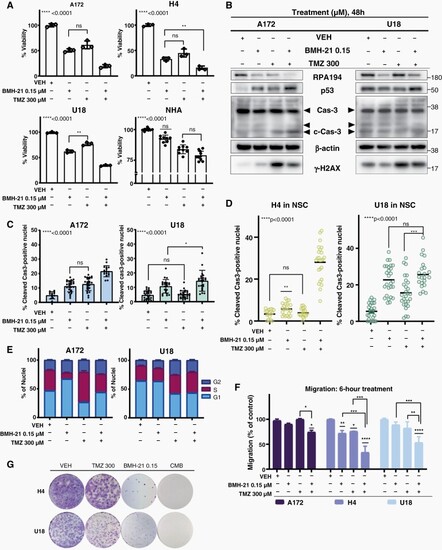
BMH-21 synergizes with TMZ (A) Cell viability of glioma cell lines compared with NHA upon 72 h treatment. (B) Indicated protein levels following 48 h treatment; beta-actin served as a loading control. (C–D) IF-based Quantification of Cleaved Cas3-positive nuclei in (C) serum- and (D) NSC-grown glioma lines (48 h). (E) Cell-cycle distribution barplot of A172 and U18 upon 24 h treatment. (F) Migration assay showing cell-migratory capacity during 6 h-treatment (G) Colony formation assay of H4 and U18 following 72 h-treatment and then 15-day-culture in drug-free media. |
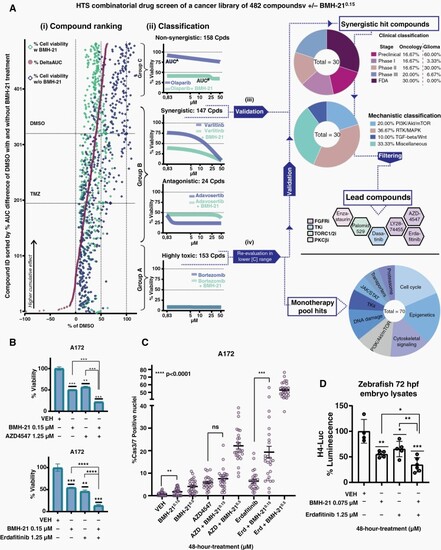
High-throughput screen reveals compound classes that synergize with BMH-21. A172 cells were treated with 482 compounds in 5 concentrations, +/−BMH-210.15 for 72 h. (A) Data analysis and hit selection pipeline. (1) Compound ranking based on %δAUC. Cell viability (%DMSO) for each compound (y-axis) when combined with DMSO or BMH-210.15, as well as the %δAUC; horizontal broken lines indicate DMSO/TMZ controls. (2) Ranked compounds assigned into 3 groups (A–C) based on dose-response profiles indicated by brackets. (3) Synergistic compounds validation (Group B). Hits shown in pie charts, classified based on clinical stage and MoA; final-lead compounds shown with their MoA., and (4) Reevaluation of the 70 monotherapy hits (MoA classification pie chart). (B) A172 Cell viability (72 h treatment) and (C) Cas3/7-positive nuclei (48 treatment) with final synergistic pairs. (D) Luminescence from zebrafish 72 hpf-embryos (48 h-treatment). VEH mean value = 100%luminescence. |

RiBi inhibition in glioma cells triggers an FGF2/FGFR1 response. (A) Cas3/7-positive nuclei following FGFR1-knockdown (KD). (B–C) FGF2 protein levels quantification by IF. (D) Immunofluorescence images in H4 cells. Scale bar, 10μm. (E–G) FGF2 signal quantification by immunofluorescence following POLR1A (E) or FGFR1 (F–G) depletion. (H) Indicated protein levels in A172 and H4 (I) Indicated protein levels following time-course treatment with BMH-21 and/or ERD in H4. (J) SOX2 and FGFR1 (left) or FGF2 (right) protein levels were treated overnight following FGFR1- or FGF2-KD. Beta-actin or tubulin served as loading controls. (K) Quantification of SOX2 protein levels by immunofluorescence following BMH-21 and/or ERD w/wo FGF2 addition. Treatments’ duration in (A–K) was 24 h. |
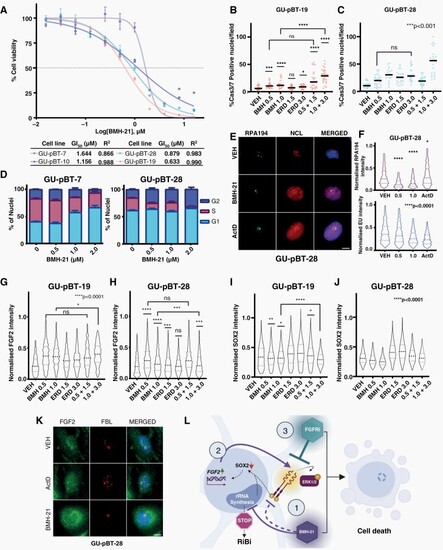
FGFR inhibition potentiates BMH-21 across a pediatric patient-derived cell line panel. (A) BMH-21 dose–response (72 h) in 4 cell lines derived from pediatric GBM tumors with corresponding GI50 values. (B–C) Cas3/7-positive nuclei of GU-pBT-19 and GU-pBT-28 cells. (D) Cell cycle distribution barplot of GU-pBT-7 and GU-pBT-28 following Click-it-EdU-labeling. (E) Representative immunofluorescence images of GU-pBT-28 stained against RPA194&NCL, Scale bar 10 µm (F) RPA194 protein levels quantification by immunofluorescence and RNA synthesis quantified by Click-it-EU-labeling in GU-pBT-28 treated with BMH-21. (G–H) FGF2 and (I–J) SOX2 protein levels quantification by immunofluorescence in GU-pBT-19 and GU-pBT-28 cells. (K) Representative immunofluorescence images of GU-pBT-28 stained against FBL and FGF2, Scale bar 10 µm. The treatment duration was 24 h for (B-F, K) and 48 h for (G–J). (L) Proposed model of synergy: (1) BMH-21 blocks Pol I and downregulates FGFR1 and SOX2., (2) FGF2 is upregulated, released from the nucleolus and secreted, feeding the FGFR1/ERK1/2 feedback loop and rescuing stemness-associated genes to support self-renewal and survival under stress., and (3) Combination of Pol I Inhibition with FGFRi blocks the feedback loop, inhibits the expression of stem cell-associated phenotypes and synergistically induces cell death. Created with Biorender. |