
|
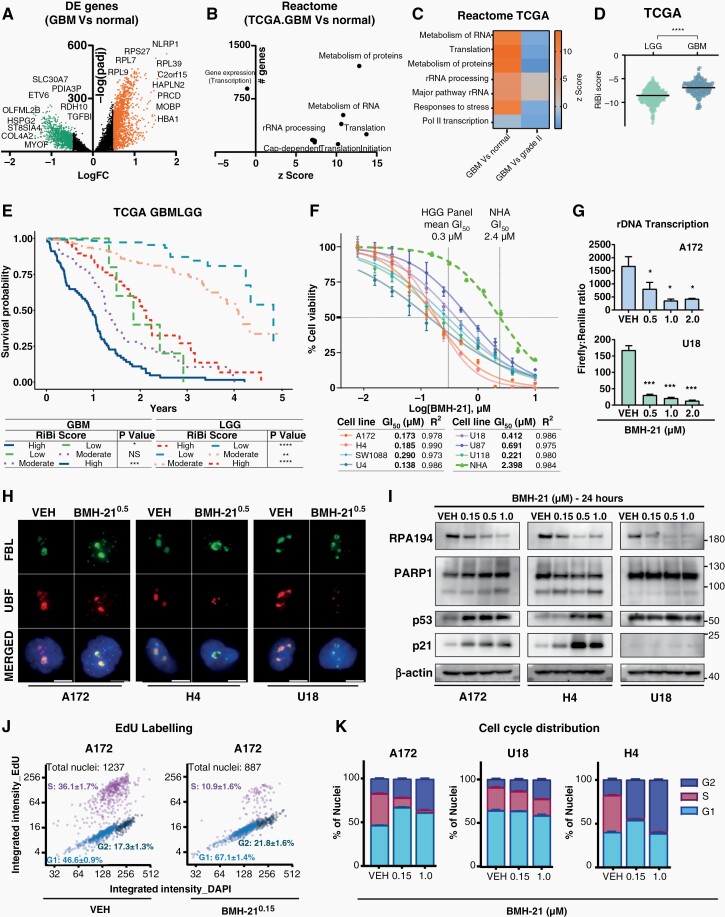
Fig. 1 RiBi is a relevant target for high-grade gliomas. (A) Differential expression (DE) analysis of RNAseq data between GBM (TCGA) and normal samples, with downregulated/green and upregulated/orange genes (log2FC > 0.5, padj < 0.05). (B) Reactome pathway enrichment analysis of DE genes from (A). z-score shows the tendency of genes within a term to be up/downregulated. (C) DE genes z-score-heatmap among GBM-normal or stages II to IV samples. (D) RiBi score and glioma grading association in TCGA cohort. (E) Kaplan–Mayer plot showing survival advantage of low versus moderate and high RiBi GBMLGG patients in TCGA. (F) BMH-21 dose–response (72 h) in normal human astrocytes (NHA) and glioma cell lines, with corresponding GI50 values (G) rDNA transcription in A172 and U18, quantified using an rRNA-promoter reporter assay. (H) Representative immunofluorescence images of nucleolar proteins FBL and UBF in glioma cells. Nuclei are counterstained with DAPI. Scale bar, 10 μm. (I) Indicated protein levels in glioma cells; beta-actin served as loading control (J–K) Click-it EdU-based cell-cycle analysis representative dot plots (J) and stacked barplot (K) of cell-cycle distribution into G1, S, and G2.