
|
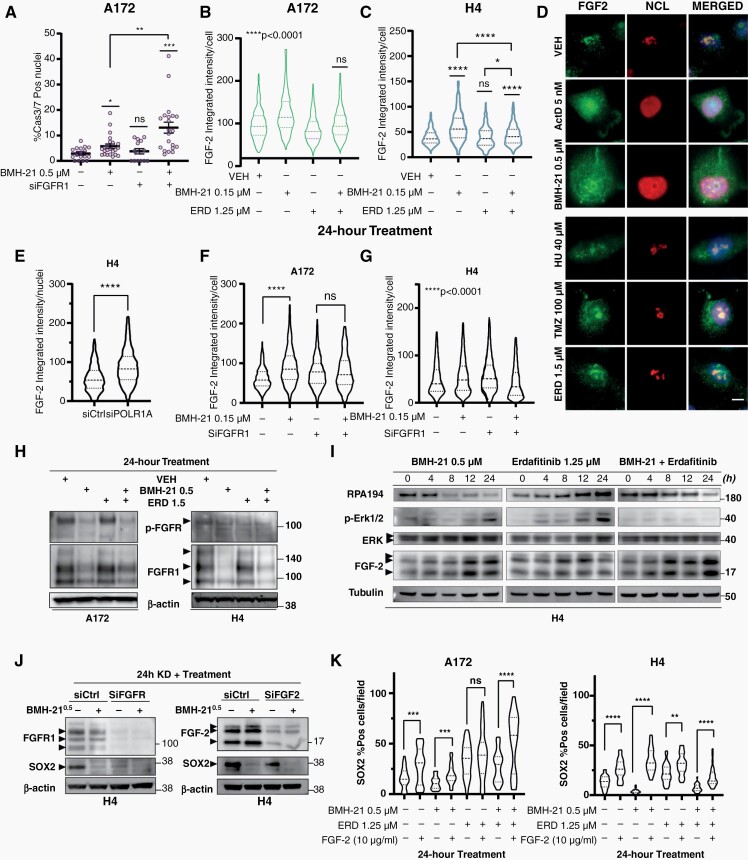
Fig. 5 RiBi inhibition in glioma cells triggers an FGF2/FGFR1 response. (A) Cas3/7-positive nuclei following FGFR1-knockdown (KD). (B–C) FGF2 protein levels quantification by IF. (D) Immunofluorescence images in H4 cells. Scale bar, 10μm. (E–G) FGF2 signal quantification by immunofluorescence following POLR1A (E) or FGFR1 (F–G) depletion. (H) Indicated protein levels in A172 and H4 (I) Indicated protein levels following time-course treatment with BMH-21 and/or ERD in H4. (J) SOX2 and FGFR1 (left) or FGF2 (right) protein levels were treated overnight following FGFR1- or FGF2-KD. Beta-actin or tubulin served as loading controls. (K) Quantification of SOX2 protein levels by immunofluorescence following BMH-21 and/or ERD w/wo FGF2 addition. Treatments’ duration in (A–K) was 24 h.