
|
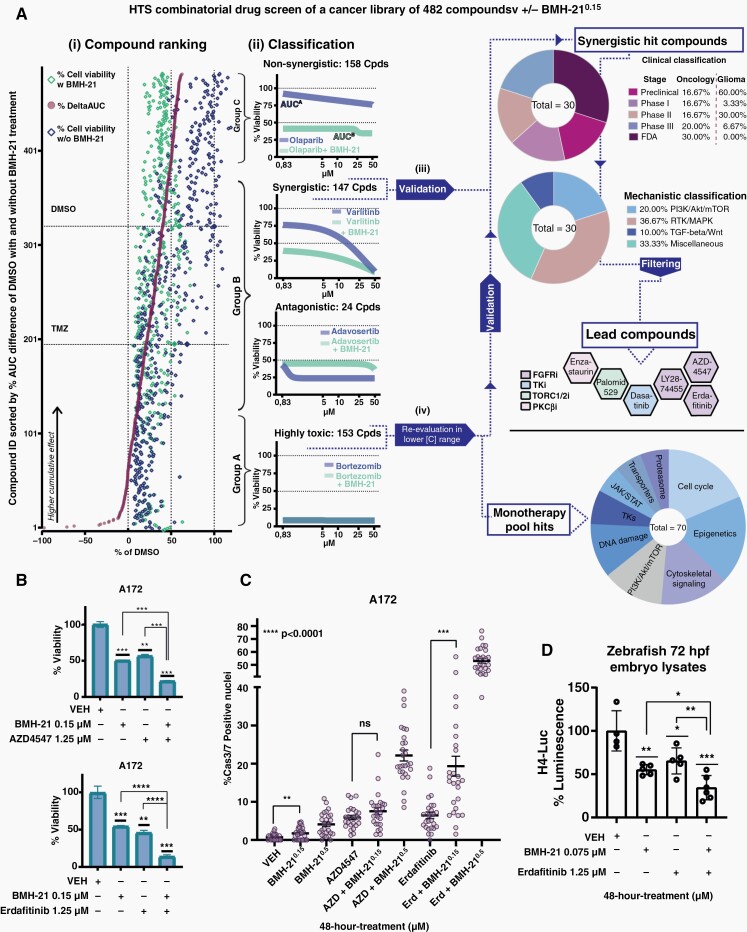
Fig. 4 High-throughput screen reveals compound classes that synergize with BMH-21. A172 cells were treated with 482 compounds in 5 concentrations, +/−BMH-210.15 for 72 h. (A) Data analysis and hit selection pipeline. (1) Compound ranking based on %δAUC. Cell viability (%DMSO) for each compound (y-axis) when combined with DMSO or BMH-210.15, as well as the %δAUC; horizontal broken lines indicate DMSO/TMZ controls. (2) Ranked compounds assigned into 3 groups (A–C) based on dose-response profiles indicated by brackets. (3) Synergistic compounds validation (Group B). Hits shown in pie charts, classified based on clinical stage and MoA; final-lead compounds shown with their MoA., and (4) Reevaluation of the 70 monotherapy hits (MoA classification pie chart). (B) A172 Cell viability (72 h treatment) and (C) Cas3/7-positive nuclei (48 treatment) with final synergistic pairs. (D) Luminescence from zebrafish 72 hpf-embryos (48 h-treatment). VEH mean value = 100%luminescence.