
Fig. 2
- ID
- ZDB-FIG-231102-17
- Publication
- Zisi et al., 2022 - Small Molecule-mediated Disruption of Ribosome Biogenesis Synergizes With FGFR Inhibitors to Suppress Glioma Cell Growth
- Other Figures
- All Figure Page
- Back to All Figure Page
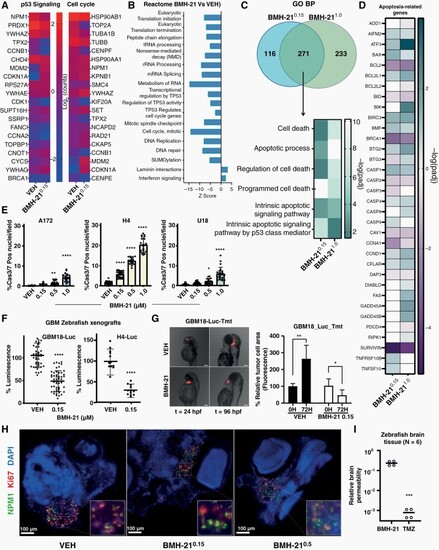
BMH-21 induces glioma cell death and suppresses glioma cell growth in zebrafish model. (A) Heatmaps showing the most significant DE genes corresponding to Reactome terms p53-Signaling (left) and Cell Cycle (right) following indicated 24 h-treatments (μM). (B) Reactome PE analysis in DE genes (g: Profiler). (C) Venn diagram comparing GO-BP ontology terms among BMH-210.15 and BMH-211.0 (padj < 0.05) corresponding to cell death-related signatures. (D) Heatmap shows commonly enriched terms and gene perturbations corresponding to apoptotic signatures among BMH-21 concentrations. (E) Quantification of Cas3/7-positive nuclei (48h-treatment). (F) Quantification of the luminescent signal emitted from injected zebrafish embryo lysates (72h-treatment). VEH mean signal intensity = 100% luminescence. (G) representative images and area quantification of fluorescent tumor cell transplants 24 and 96 hpf. (H) Immunofluorescence images of zebrafish cryosections (72 h-treatment, stained for Ki67 and NPM1). Insets depict magnifications of the designated regions. Scale bar 100 μm. (I) Relative BMH-21 and TMZ quantification in dissected zebrafish brains following 4 h-treatment, suggesting BBB permeability. |