
- Title
-
Requirement of Zebrafish Adcy3a and Adcy5 in Melanosome Dispersion and Melanocyte Stripe Formation
- Authors
- Zhang, L., Wan, M., Tohti, R., Jin, D., Zhong, T.P.
- Source
- Full text @ Int. J. Mol. Sci.
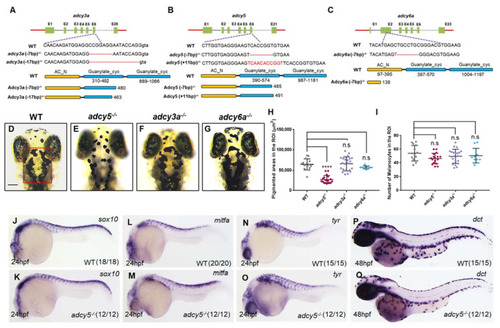
adcy5 mutation affects melanosome dispersion during embryonic stages. (A–C) The sgRNA target is designed in the sixth exon of adcy3a (A) and adcy5 (B), and the second exon of adcy6a (C). Schematic representations of the nucleotide sequences show a 7-bp and a 17-bp deletion in adcy3a-/- (A), a 7-bp deletion and an 11-bp insertion in adcy5-/- (B), and a 7-bp deletion in adcy6a-/- (C). Red dashes indicate the deleted bases; the inserted bases are marked in red. Predicted domain structure of Adcy3a, Adcy5, and Adcy6a from wild-type and mutant amino acid sequences. (D–G) adcy3a-/- (F) and adcy6a-/- (G) single mutants show normal melanosome dispersion as seen in WT embryos (D) under dark conditions at 4dpf, whereas adcy5-/- single mutants (E) exhibit aggregated melanosomes. The red box in (D) indicates a defined region of interest (ROI) to quantify pigmentation coverage and melanocyte numbers. The ROI was restricted to the range from the middle of the eyes to the posterior of the hindbrain. Scale bar = 100 μm in (D–G). (H) Pigmentation coverage in the ROI is significantly decreased in adcy5-/- mutants compared to WT embryos (Student’s t-test, **** p < 0.0001, n.s., not significant, p > 0.05). (I) Statistical analyses show that the number of melanocytes in adcy3a-/-, adcy5-/-, and adcy6a-/- is comparable with that of WT embryos (Student’s t-test, n.s., not significant, p > 0.05). (J–Q) WISH analyses show the expression levels of sox10, mitfa, tyr, and dct in adcy5-/- mutants are comparable with those in WT embryos. |
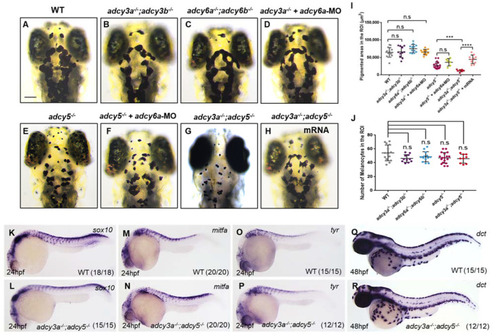
adcy3a-/- and adcy5-/- double mutants show high melanosome aggregation. (A–H) adcy3a-/-;adcy3b-/- (B) and adcy6a-/-;adcy6b-/- (C) double mutants as well as adcy6a-MO-injected adcy3a-/- mutants (D) display normal distribution of melanosomes as that of WT embryos (A) under dark conditions at 4dpf. adcy6a-MO injected adcy5-/- mutants (F) exhibit comparable pigmentation as adcy5-/- (E). adcy3a-/-;adcy5-/- double mutants (G) develop a higher degree of aggregation of melanosomes than adcy5-/-, while co-injection of adcy3a and adcy5 mRNA can significantly rescue the defects in melanosome aggregation in adcy3a-/-;adcy5-/- double mutants (H). Scale bar = 100 μm in (A–H). (I) Pigmentation coverage shows no difference among wild-type embryos, adcy3a-/-;adcy3b-/-, adcy6a-/-;adcy6b-/-, and adcy3a-/- mutants injected with adcy6a-MO, as well as between adcy5-/- and adcy5-/- mutants injected with adcy6a-MO. adcy3a-/-;adcy5-/- double mutants have significantly reduced pigmentation areas compared to adcy5-/-, which can be rescued by co-injection of adcy3a and adcy5 mRNA (Student’s t-test, *** p < 0.001, **** p < 0.0001, n.s., not significant, p > 0.05). (J) Statistical analyses show that the number of melanocytes in adcy5-/- single mutants, and adcy3a-/-;adcy3b-/-, adcy6a-/-;adcy6b-/- and adcy3a-/-;adcy5-/- double mutants is comparable with that of WT embryos (Student’s t-test, n.s., not significant, p > 0.05). (K–R) WISH analyses showed the expression levels of sox10, mitfa, tyr, and dct are normal in adcy5-/-;adcy3a-/- compared to WT embryos. |
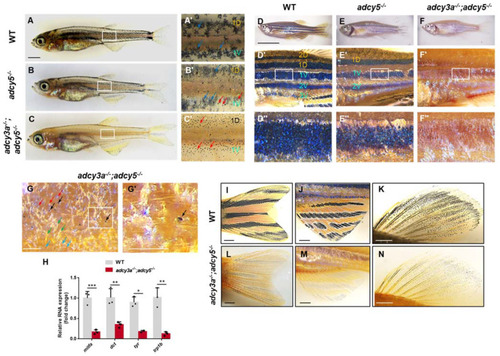
adcy3a and adcy5 are required for adult melanin patterning. (A–C) WT zebrafish develop metamorphic melanocyte stripes around 30 days, including 1D and 1V, along with corolla-like patterns of melanosomes in most melanocytes (A). adcy5-/- mutants establish normal metamorphic stripes, but some melanocytes present punctate distribution of melanosomes (B). adcy3a-/-;adcy5-/- double mutants are unable to form corolla distribution of melanosomes and instead punctate melanosomes (C). (A′–C′) are the magnified images of boxes in (A–C) (the red arrows indicate punctate melanocytes; the blue arrows indicate corolla melanocytes). Scale bar = 1000 μm in (A–C). (D–F) Adult wild-type zebrafish form five melanocyte stripes, including three ventral black stripes 1V, 2V, and 3V, and two dorsal stripes 1D and 2D along the dorsoventral axis (D). adcy5-/- mutants (E) show three melanocyte stripes, including black stripes 1D, 1V, and 2V, with a lower density of melanocytes, compare to WT zebrafish (F). adcy3a-/-;adcy5-/- double mutants fail to establish normal melanocyte stripes, along with a few punctate melanocytes (F). (D′–F′) are the partially magnified images of (D–F), and (D″–F″) are the magnified images of boxes in (D′–F′). 1D: dorsal primary black stripe; 1V: ventral primary black stripe; 2D: dorsal secondary black stripe; 2V: ventral secondary black stripe; 3V: the third ventral black stripe. Scale bar = 10 mm in (D–F). (G) Adult adcy3a-/-;adcy5-/- double mutants develop a few pigmented melanocytes, along with many unpigmented melanocytes (the red arrows indicate unpigmented melanocytes; the black arrows indicate pigmented melanocytes; the blue arrows indicate xanthophores; the green arrows indicate iridophores). (G′) is the partially magnified images of boxes in (G). Scale bar = 100 μm. (H) qPCR analyses of mitfa, dct, tyr, and trp1b expression in the adult skin from WT zebrafish or adcy3a-/-;adcy5-/- mutants (Student’s t-test, * p < 0.05, ** p < 0.01, *** p < 0.001). (I–N) The caudal, anal, and dorsal fins in adcy3a-/-;adcy5-/- double mutants show highly aggregated melanosomes compared with those in WT zebrafish. Scale bar = 1000 μm. EXPRESSION / LABELING:
PHENOTYPE:
|
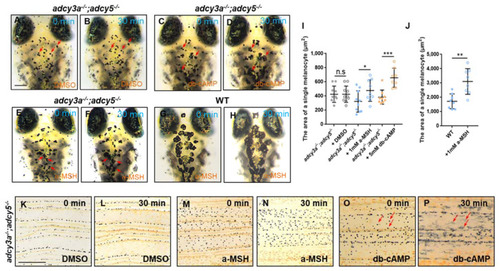
Activation of PKA ameliorates melanosome aggregation in adcy3a-/-;adcy5-/- double mutants. (A–H) 10-day-old adcy3a-/-;adcy5-/- double mutants have no response to DMSO treatment (A,B), but show significant dispersion of melanosomes when exposed to db-cAMP for 30 min (C,D). The melanosomes in a few melanocytes show mild dispersion when exposed adcy3a-/-;adcy5-/- double mutants to a-MSH for 30 min (E,F), while they dramatically disperse in almost all melanocytes in WT larvae (G,H). The red arrows indicate the same melanocytes from the same embryo before and after treatment with chemical compounds. Scale bar = 250 μm in (A–H). (I,J) Statistical analyses of the pigmented area of single melanocyte in adcy3a-/-;adcy5-/- double mutants (I) and WT embryos (J) before and after treatment with DMSO, a-MSH, and db-cAMP, respectively (Student’s t-test n.s., not significant, p > 0.05, * p < 0.05. ** p < 0.01. *** p < 0.001). (K–P) No melanosome dispersion is detected in DMSO (K,L) or a-MSH-treated caudal fins (M,N) derive from adcy3a-/-;adcy5-/- double mutants, but almost all melanosomes disperse in db-cAMP-treated mutant caudal fins (O,P). The red arrows indicate some dramatically dispersed melanosomes from the same caudal fin before and after treatment with db-cAMP. Scale bar = 250 μm in (K–P). |
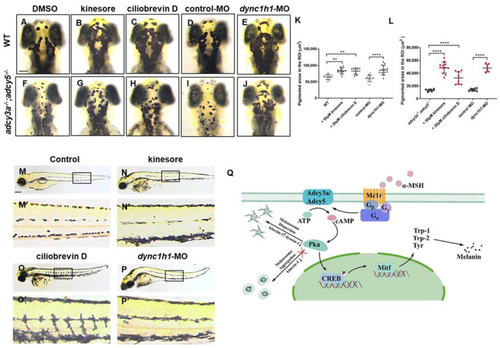
Activation of kinesin-1 or Inhibition of cytoplasmic dynein-1 rescues the phenotype of high melanosome aggregation in adcy3a-/-;adcy5-/- double mutants. (A–C) WT embryos treated with either kinesore or ciliobrevin D from 24 hpf to 96 hpf show high melanosome dispersion when compared with DMSO controls. (D,E) dync1h1-MO-injected WT embryos display significant melanosome dispersion compared with control-MO-injected embryos. (F–H) adcy3a-/-;adcy5-/- double mutants show significant dispersion of melanosomes when treated with either kinesore or ciliobrevin D from 24 hpf to 96 hpf compared with DMSO-treated groups. (I,J) adcy3a-/-;adcy5-/- double mutants injected with dync1h1-MO exhibit significant dispersion of melanosomes in comparison with controls. (K,L) Statistical analysis of pigmentation coverage in WT embryos (K) and adcy3a-/-;adcy5-/- double mutants (L) treated with DMSO, kinesore, and ciliobrevin D, respectively, as well as either injected with dync1h1-MO or control-MO (Student’s t-test, ** p < 0.01. **** p < 0.0001). (M–O) The dispersion of melanosomes throughout the body is detected in kinesore (N,N′) or ciliobrevin D-treated adcy3a-/-;adcy5-/- double mutants (O,O′), compared with DMSO-treated groups (M,M′). (M′–O′) are the partially magnified images of boxes in (M–O). (P) dync1h1-MO injected adcy3a-/-;adcy5-/- double mutants display melanosome dispersion throughout the body. (P′) is the partially magnified images of boxes in (P). (Q) A working model for Adcy3a and Adcy5 signaling cascades involving melanosome dispersion and melanin synthesis: α-MSH binds to Mc1r and activates Adcy3a and Adcy5, leading to intracellular cAMP increase; the increased cAMP stimulates Pka to guide melanosome dispersion by activating kinesin-1 and suppressing cytoplasmic dynein-1, and promotes melanin synthesis through increasing the expression of mitf and its downstream target genes tyr, trp-1, and trp-2. Scale bar = 100 μm in (A–J). Scale bar = 250 μm in (M–P). |