
- Title
-
A role for the centrosome in regulating the rate of neuronal efferocytosis by microglia in vivo
- Authors
- Möller, K., Brambach, M., Villani, A., Gallo, E., Gilmour, D., Peri, F.
- Source
- Full text @ Elife
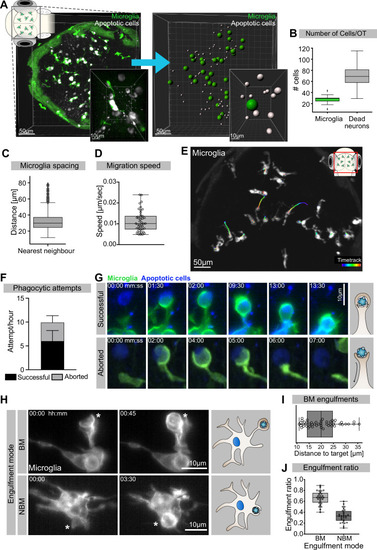
(A) Left: representative image of the OT of a 3.5-day post-fertilization (dpf) embryo with microglia (green; Tg(mpeg1:eGFP-caax)) and dying neurons (grey; Tg(nbt:dLexPR-LexOP:secA5-BFP)). Right: automated spot detection of left image to determine the spatial position of microglia and apoptotic cells. (B) Number of microglia and dead neurons within the OT (N = 31). (C) Distance from each microglia to its closest neighbour (N = 31). (D) Microglia migration speed, measured by tracking microglia for 2 hr (N = 2, 20–23 microglia analysed per zebrafish). (E) A representative image of a 3-dpf zebrafish brain, showing microglia (grey; Tg(mpeg1:eGFP-caax)) and their trajectory/track over 1 hr. (F) The total number of phagocytic attempts initiated by microglia per hour; stacked barplot shows the proportion of successful and aborted phagocytic attempts (N = 4, 5–9 microglia analysed per fish). (G) Upper panel: microglia (green; Tg(mpeg1:eGFP-caax)) phagocytic cup that results in the successful formation of a phagosome around a dead neuron (blue; Tg(nbt:dLexPR-LexOP:secA5-BFP)). Lower panel: phagocytic cup formation where the phagocytic attempt is aborted. (H) Microglia (grey; Tg(mpeg1:eGFP-caax)) phagocytosis happens at two locations; upper panel: phagosome forms at the tip of a long cellular extension. Lower panel: phagosome forms directly at the cell soma. Full time lapse is found in Figure 1—video 2. (I) Length of successful phagocytic branches during branch-mediated (BM) engulfments (N = 3, n = 7, 5–16) engulfments analysed per microglia. (J) Ratio between BM and non-branch-mediated (NBM) engulfments (N = 4, 5–9 microglia analysed per fish). Bars represent mean +/- SD (F). Boxplots depict mean and 1.5x interquartile range (B, C) or mean +/- min to max values (D, F, I, J). N refers to the number of zebrafish and n to the number of microglia examined.
|
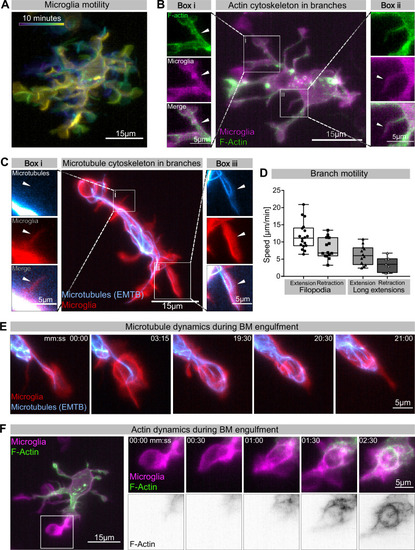
(A) Colour-coded overlay of a 10 min time lapse of microglia Tg(mpeg1:Gal4; UAS:lyn-tagRFPt) showing their branch dynamics. (B) Microglia (magenta; Tg(mpeg1:Gal4; UAS:lyn-tagRFPt)) and F-actin (green; UAS:UtrCH-mNG). Box i shows thicker extensions, and box ii shows thin filopodia, both containing F-actin. (C) Microglia (red; Tg(csf1ra:GAL4-VP16; UAS:lyn-tagRFPt)) and microtubules (cyan; Tg(UAS:EMTB-3xGFP)). Box i shows a thin filopodia, and box ii shows a thicker extension; microtubules are only observed in thicker extensions. The intensity histogram of images in boxes i and ii from (B) and (C) has been adjusted to highlight the weak fluorescent signals of the cytoskeletal components. (D) The speed at which both thick extensions and thin filopodia extend and retract, measured in μm/min (n = 2, 2–10 retractions/extensions analysed per microglia, boxplot depict mean +/- min to max values). (E) The panel shows the same branch as in (C) box ii at a later time point, forming a phagosome. (F) Microglia (magenta; Tg(mpeg1:Gal4; UAS:lyn-tagRFPt)) and F-actin (green; (UAS:UtrCH-mNG)). The panel shows how F-actin is found in the cellular extension and engages with the phagosome soon after this has formed. Full time lapse is found in Figure 2—video 1. n refers to the number of microglia examined.
|
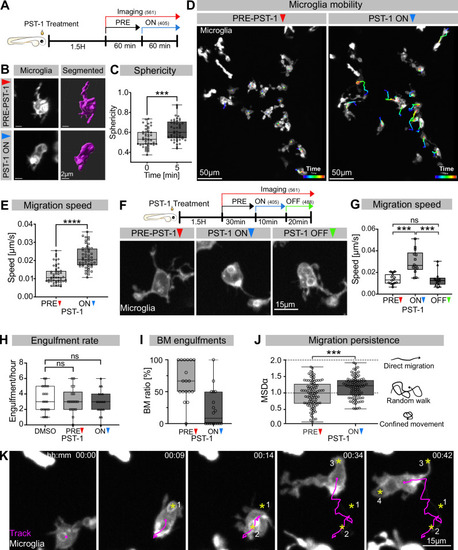
(A) Schematic showing the experimental setup: Embryos were treated for 1.5 hr with PST-1, then imaged for 1 hr with 561 nm light (PRE-PST-1) and then imaged for another hour with 561 nm and 405 nm light to activate PST-1 (PST-1 ON). (B) Left: microglia (grey; Tg(mpeg1:Gal4; UAS:lyn-tagRFPt)) before (upper) and after (lower) PST-1 activation. Right: 3D segmentation of the cells in the left panel. (C) Microglia sphericity before and 5 min after PST-1 activation. Segmentation in (B) was used to extract surface area and volume to calculate sphericity (N = 4, 6–15 microglia analysed per fish, ***p=0.0005). (D) 3D tracking of microglia for 1 hr before (left) and after (right) PST-1 activation, displayed as colour-coded tracks overlayed on top of microscopy images of the microglia. Full time lapse is found in Figure 3—video 1. (E) Microglia migration speed measured in μm/s (N = 4, 6–18 microglia analysed per fish, ****p<0.0001). (F) Upper: schematic of the ON-OFF experiment. Lower: microglia (grey; Tg(mpeg1:Gal4; UAS:lyn-tagRFPt)) shown before PST-1 activation (PRE-PST-1) and when the drug is turned ON with 405 nm light (PST-1-ON) and OFF again using 488 nm light (PST-1-OFF). A paired, non-parametric Friedman test with Dunn’s correction was used to compare the three groups (***p=0.0002). (G) Microglia migration speed during the ON-OFF experiment, measured in μm/s (N = 1, n = 14). (H) Microglia engulfment rate after DMSO (N = 3, 5–8 microglia analysed per fish) or PST-1 treatment (N = 3, 6 microglia analysed per fish). (I) Percentage of branch-mediated (BM) engulfments before (left) and after (right) activation of PST-1 (N = 3, 6 microglia analysed per fish). (J) Left: microglia migration persistence measured with the mean square displacement alpha (MSDα) before and after PST-1 activation (N = 4, 6–18 microglia analysed per fish, ***p=0.0001) Right: schematic of what the MSDα values imply. (K) Representative time lapse of a microglia (grey) treated with activated PST-1 and tracked (magenta), showing how microglia migrate towards apoptotic targets (yellow asterisk). Boxplots depict mean +/- min to max values. Groups were compared using a two-tailed, nonparametric Mann-Whitney U-test was used (C, E, H, J). When comparing reapeated measurements from the same group, a nonparametric Friedmann test with a Dunn's correction was used (G). N refers to the number of zebrafish and n to the number of microglia examined.
|
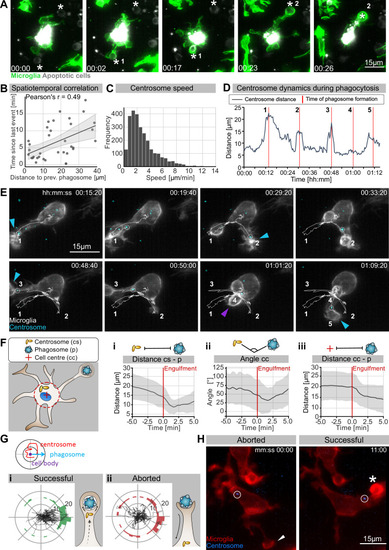
(A) Sequential uptake of two apoptotic neurons (grey; Tg(nbt:secA5-BPF)) by microglia (green; Tg(mpeg1:Gal4; UAS:lyn-tagRFPt)). Timescale is hh:mm. (B) Correlation of spatiotemporal distances between phagocytic events (N = 3, n = 7, 5–16 engulfments analysed per microglia, 95% confidence interval is depicted). (C) Speed of centrosomal movements, relative to the cell centre (N = 3, 2–3 microglia analysed per fish). (D) Movement of the centrosome, relative to the cell centre of the microglia in (E). The track shows the distance of the centrosome from the cell centre, and the red lines indicate the time of phagosome formation. (E) Time lapse of a microglia (grey; Tg(csf1ra:GAL4-VP16; UAS:lyn-tagRFPt)) and the centrosome (cyan; Tg(UAS:miRFP670-cetn4)). The microglial centrosome is encircled and tracked for 1 hr 15 min; phagocytic events are numbered and labelled; branch-mediated (BM) engulfments are indicated with a blue arrow and non-branch-mediated (NBM) engulfments are indicated with a purple arrow. Full time lapse is found in Video 5. (F) Schematic of how the centrosome (cs), cell centre (cc), and location of newly formed phagosomes (p) were tracked across many samples. (i) cs distance from cb, (ii) angle between cs and p, and (iii) distance of p from cc for 5 min before and after phagosome formation (N = 7, n = 7, 5–16 engulfments analysed per microglia, the mean +/- SD is depicted). (G) Top: schematic of how the centrosome, cell centre, and location of a newly formed phagosomes are oriented in the polar plots. Bottom: individual tracks of the centrosome relative to the cell body and the phagosome during (i) successful and (ii) aborted phagocytic attempts (N = 3, n = 7, 5–16 successful and 2–12 aborted attempts analysed per microglia). (H) Microglia (grey) and the centrosome (cyan) where the centrosome is encircled during an aborted (left, arrowhead) and a successful event (right, asterisk). Original image was processed with a Gaussian Blur filter with sigma(radius) = 1. N refers to the number of zebrafish and n to the number of microglia examined.
|
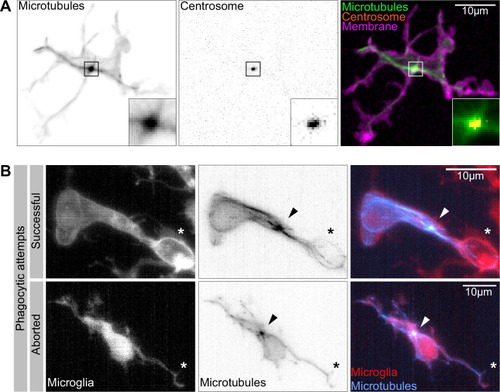
(A) Macrophage (magenta; Tg(csf1ra:GAL4-VP16; UAS:lyn-tagRFPt)) with the centrosome (UAS:miRFP670-cetn4) and microtubules (green; Tg(UAS:EB3-GFP)) labelled. The centrosome can be seen right in the centre of the MTOC (box). (B) Microglia (grey; Tg(csf1ra:GAL4-VP16; UAS:lyn-tagRFPt)) with microtubules (cyan; Tg(UAS:EB3-GFP)) labelled. The MTOC can be seen as a bright spot of growing microtubules (arrow). Top: a successful phagocytic event, full time lapse in Figure 5—video 2. The newly formed phagosome is marked with an asterisk. Bottom: an aborted attempt marked with an asterisk.
|
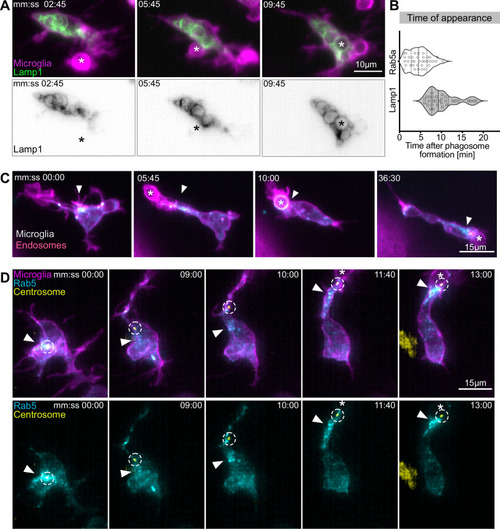
(A) Microglia (magenta; Tg(csf1ra:GAL4-VP16; UAS:lyn-tagRFPt)) and Lamp1 labelled vesicles (green; Tg(UAS:Lamp1-mGFP)) localized within the cell soma and not moving into branches. (B) Time of Rab5 (n = 3, 8–10 phagocytic events analysed per microglia) and Lamp1 (n = 3, 9–11 phagocytic events analysed per microglia) appearance at phagosome, after its formation. Violin plots have mean and quartiles depicted. (C) Microglia (magenta; Tg(csf1ra:GAL4-VP16; UAS:lyn-tagRFPt)) and Rab5-positive endosomes (cyan; UAS:mNeonGreen-Rab5a), full time lapse in Figure 6—video 1. Endosomes form a cloud (arrowhead) that moves into phagocytic branches towards forming phagosomes (asterisk). Original images were deconvolved using Huygens deconvolution. (D) Representative microglia (magenta; Tg(csf1ra:GAL4-VP16; UAS:lyn-tagRFPt)), Rab5 endosomes (cyan; UAS:mNeonGreen-Rab5a), and centrosome (yellow; UAS:miRFP670-centrin4). The centrosome (circle) moves into phagocytic branches (star) and is followed by the cloud of Rab5 endosomes (arrowhead). Original images were deconvolved using Huygens deconvolution. n refers to the number of microglia examined.
|
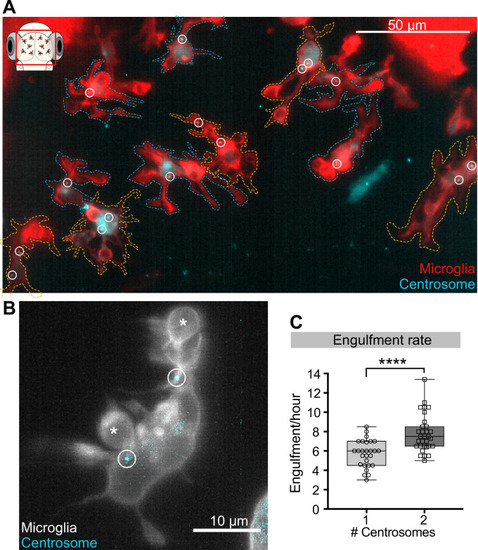
(A) Microglia (red; Tg(csf1ra:GAL4-VP16; UAS:lyn-tagRFPt)) overexpressing the centrosome marker (cyan; Tg(UAS:miRFP670-cetn4)). Due to mosaicism in the overexpression of UAS:miRFP670-cetn4, there are microglia (dashed outlines) with two centrosomes (orange cells) and matching controls with only one (blue cells) within the same brain. Centrosomes are labelled with circles. (B) Microglia (grey) overexpressing the centrosome marker (cyan) resulting in this cell having two centrosomes (circle). (C) Microglia with two centrosomes engulf more neurons (N = 8, 2–9 microglia analysed per fish). Boxplots depict mean +/- min and max values. Groups were compared using a two-tailed, nonparametric Mann-Whitney U test, ****p<0.0001. N refers to the number of zebrafish analysed.
|
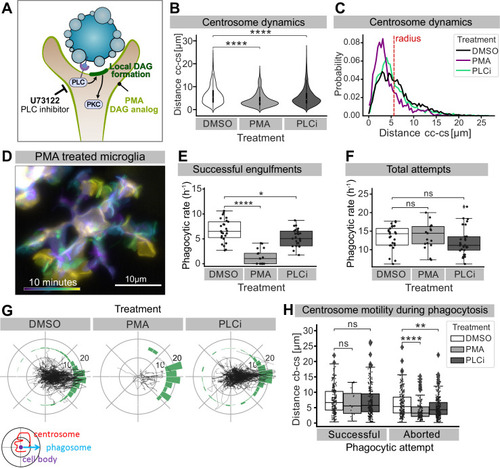
(A) Schematic showing the effect of phorbol 12-myristate 13-acetate (PMA) and pan-inhibitor of PLC (PLCi) on DAG-mediated signalling. (B) Distance of the centrosome from the cell centre in microglia after 1% DMSO (N = 4, n = 26), 2.5 μM PMA (N = 3, n = 17) or 1 μM U73122 (N = 4, n = 29) treatment. (C) Probability map of the radial location of the centrosome, relative to the cell centre, after DMSO, PMA, or PLCi treatment. (D) A colour-coded overlay of a 10 min time lapse of a representative microglia (Tg(mpeg1:Gal4; UAS:lyn-tagRFPt)) treated with 2.5 μM PMA, to show branch dynamics. (E, F) Phagocytic attempts by microglia treated with 1% DMSO (white), 2.5 μM PMA (light grey) or 1 μM U73122 (dark grey). Plots show (E) successful and (F) total phagocytic attempts (*p<0.05, ****p<0.0001). (G) Tracks of the centrosome relative to successful phagocytic events, after DMSO, PMA, or PLCi treatment. Histograms summarize the position of the centrosome at the time of phagosome formation. (H) Centrosome distance from cell centre at the time of successful or aborted phagocytic attempts, after DMSO, PMA, or PLCi treatment (*p<0.05, **p<0.01, ***p<0.001, ****p<0.0001). Violin and boxplots depict mean and 1.5x interquartile range. Groups were compared using an unpaired, nonparametric Kruskal-Wallis with Bonferroni correction. N refers to the number of zebrafish and n to the total number of microglia analysed.
|