
Figure 4
- ID
- ZDB-FIG-221211-97
- Publication
- Möller et al., 2022 - A role for the centrosome in regulating the rate of neuronal efferocytosis by microglia in vivo
- Other Figures
- All Figure Page
- Back to All Figure Page
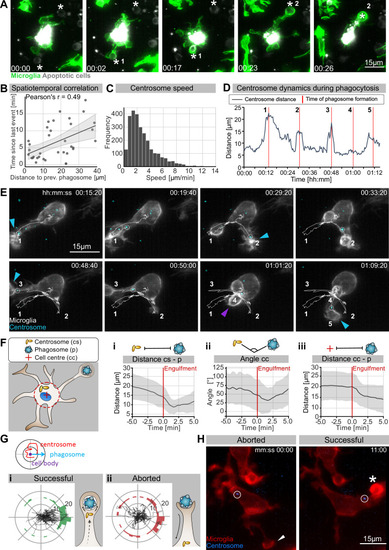
(A) Sequential uptake of two apoptotic neurons (grey; Tg(nbt:secA5-BPF)) by microglia (green; Tg(mpeg1:Gal4; UAS:lyn-tagRFPt)). Timescale is hh:mm. (B) Correlation of spatiotemporal distances between phagocytic events (N = 3, n = 7, 5–16 engulfments analysed per microglia, 95% confidence interval is depicted). (C) Speed of centrosomal movements, relative to the cell centre (N = 3, 2–3 microglia analysed per fish). (D) Movement of the centrosome, relative to the cell centre of the microglia in (E). The track shows the distance of the centrosome from the cell centre, and the red lines indicate the time of phagosome formation. (E) Time lapse of a microglia (grey; Tg(csf1ra:GAL4-VP16; UAS:lyn-tagRFPt)) and the centrosome (cyan; Tg(UAS:miRFP670-cetn4)). The microglial centrosome is encircled and tracked for 1 hr 15 min; phagocytic events are numbered and labelled; branch-mediated (BM) engulfments are indicated with a blue arrow and non-branch-mediated (NBM) engulfments are indicated with a purple arrow. Full time lapse is found in Video 5. (F) Schematic of how the centrosome (cs), cell centre (cc), and location of newly formed phagosomes (p) were tracked across many samples. (i) cs distance from cb, (ii) angle between cs and p, and (iii) distance of p from cc for 5 min before and after phagosome formation (N = 7, n = 7, 5–16 engulfments analysed per microglia, the mean +/- SD is depicted). (G) Top: schematic of how the centrosome, cell centre, and location of a newly formed phagosomes are oriented in the polar plots. Bottom: individual tracks of the centrosome relative to the cell body and the phagosome during (i) successful and (ii) aborted phagocytic attempts (N = 3, n = 7, 5–16 successful and 2–12 aborted attempts analysed per microglia). (H) Microglia (grey) and the centrosome (cyan) where the centrosome is encircled during an aborted (left, arrowhead) and a successful event (right, asterisk). Original image was processed with a Gaussian Blur filter with sigma(radius) = 1. N refers to the number of zebrafish and n to the number of microglia examined.
|