
Figure 7
- ID
- ZDB-IMAGE-221211-109
- Publication
- Möller et al., 2022 - A role for the centrosome in regulating the rate of neuronal efferocytosis by microglia in vivo
- All Figures
- Figures for Möller et al., 2022
|
Figure 7
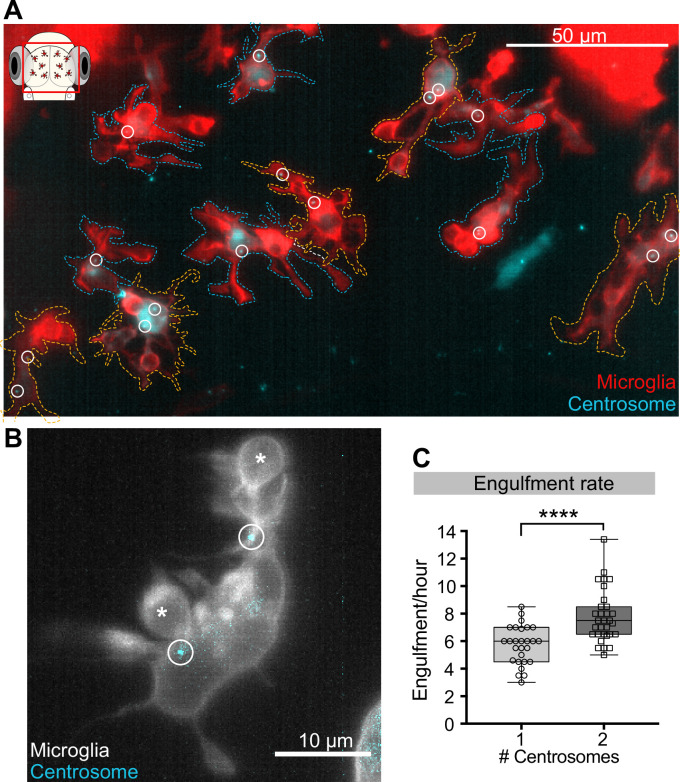
(A) Microglia (red; Tg(csf1ra:GAL4-VP16; UAS:lyn-tagRFPt)) overexpressing the centrosome marker (cyan; Tg(UAS:miRFP670-cetn4)). Due to mosaicism in the overexpression of UAS:miRFP670-cetn4, there are microglia (dashed outlines) with two centrosomes (orange cells) and matching controls with only one (blue cells) within the same brain. Centrosomes are labelled with circles. (B) Microglia (grey) overexpressing the centrosome marker (cyan) resulting in this cell having two centrosomes (circle). (C) Microglia with two centrosomes engulf more neurons (N = 8, 2–9 microglia analysed per fish). Boxplots depict mean +/- min and max values. Groups were compared using a two-tailed, nonparametric Mann-Whitney U test, ****p<0.0001. N refers to the number of zebrafish analysed.
Microglia with two centrosomes are more efficient phagocytes.