
Figure 6
- ID
- ZDB-IMAGE-221211-107
- Publication
- Möller et al., 2022 - A role for the centrosome in regulating the rate of neuronal efferocytosis by microglia in vivo
- All Figures
- Figures for Möller et al., 2022
|
Figure 6
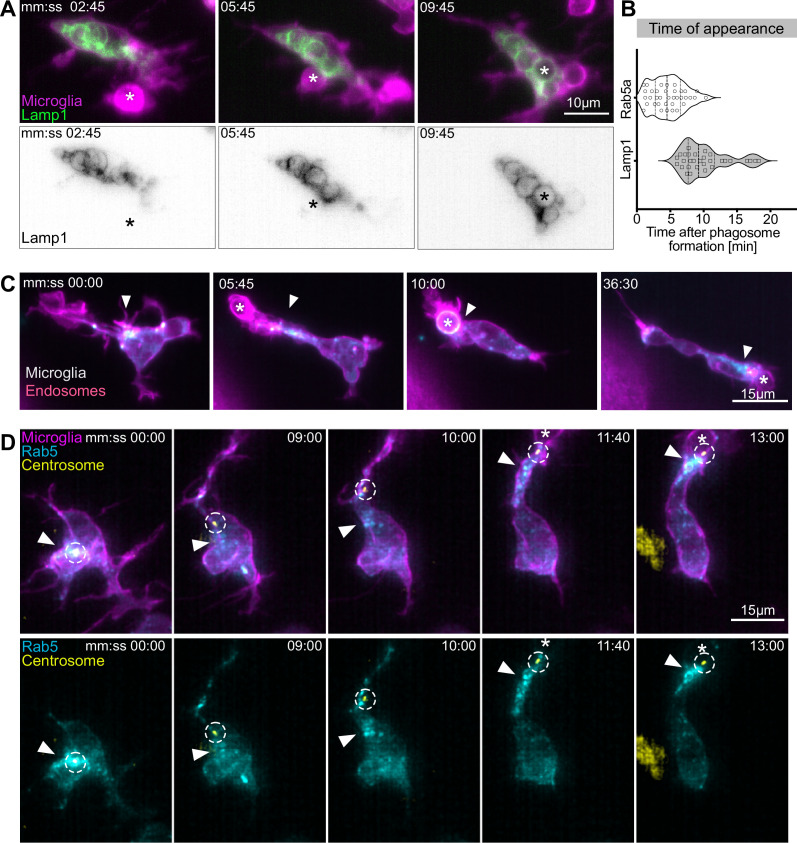
(A) Microglia (magenta; Tg(csf1ra:GAL4-VP16; UAS:lyn-tagRFPt)) and Lamp1 labelled vesicles (green; Tg(UAS:Lamp1-mGFP)) localized within the cell soma and not moving into branches. (B) Time of Rab5 (n = 3, 8–10 phagocytic events analysed per microglia) and Lamp1 (n = 3, 9–11 phagocytic events analysed per microglia) appearance at phagosome, after its formation. Violin plots have mean and quartiles depicted. (C) Microglia (magenta; Tg(csf1ra:GAL4-VP16; UAS:lyn-tagRFPt)) and Rab5-positive endosomes (cyan; UAS:mNeonGreen-Rab5a), full time lapse in Figure 6—video 1. Endosomes form a cloud (arrowhead) that moves into phagocytic branches towards forming phagosomes (asterisk). Original images were deconvolved using Huygens deconvolution. (D) Representative microglia (magenta; Tg(csf1ra:GAL4-VP16; UAS:lyn-tagRFPt)), Rab5 endosomes (cyan; UAS:mNeonGreen-Rab5a), and centrosome (yellow; UAS:miRFP670-centrin4). The centrosome (circle) moves into phagocytic branches (star) and is followed by the cloud of Rab5 endosomes (arrowhead). Original images were deconvolved using Huygens deconvolution. n refers to the number of microglia examined.
Movement of the centrosome correlates with targeted vesicular trafficking towards phagosomes.