
Figure 3
- ID
- ZDB-FIG-221211-95
- Publication
- Möller et al., 2022 - A role for the centrosome in regulating the rate of neuronal efferocytosis by microglia in vivo
- Other Figures
- All Figure Page
- Back to All Figure Page
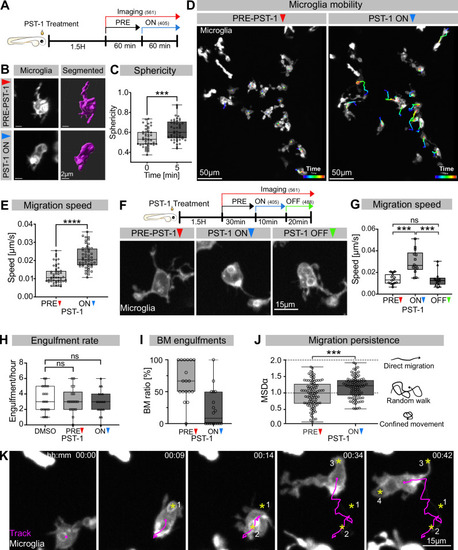
(A) Schematic showing the experimental setup: Embryos were treated for 1.5 hr with PST-1, then imaged for 1 hr with 561 nm light (PRE-PST-1) and then imaged for another hour with 561 nm and 405 nm light to activate PST-1 (PST-1 ON). (B) Left: microglia (grey; Tg(mpeg1:Gal4; UAS:lyn-tagRFPt)) before (upper) and after (lower) PST-1 activation. Right: 3D segmentation of the cells in the left panel. (C) Microglia sphericity before and 5 min after PST-1 activation. Segmentation in (B) was used to extract surface area and volume to calculate sphericity (N = 4, 6–15 microglia analysed per fish, ***p=0.0005). (D) 3D tracking of microglia for 1 hr before (left) and after (right) PST-1 activation, displayed as colour-coded tracks overlayed on top of microscopy images of the microglia. Full time lapse is found in Figure 3—video 1. (E) Microglia migration speed measured in μm/s (N = 4, 6–18 microglia analysed per fish, ****p<0.0001). (F) Upper: schematic of the ON-OFF experiment. Lower: microglia (grey; Tg(mpeg1:Gal4; UAS:lyn-tagRFPt)) shown before PST-1 activation (PRE-PST-1) and when the drug is turned ON with 405 nm light (PST-1-ON) and OFF again using 488 nm light (PST-1-OFF). A paired, non-parametric Friedman test with Dunn’s correction was used to compare the three groups (***p=0.0002). (G) Microglia migration speed during the ON-OFF experiment, measured in μm/s (N = 1, n = 14). (H) Microglia engulfment rate after DMSO (N = 3, 5–8 microglia analysed per fish) or PST-1 treatment (N = 3, 6 microglia analysed per fish). (I) Percentage of branch-mediated (BM) engulfments before (left) and after (right) activation of PST-1 (N = 3, 6 microglia analysed per fish). (J) Left: microglia migration persistence measured with the mean square displacement alpha (MSDα) before and after PST-1 activation (N = 4, 6–18 microglia analysed per fish, ***p=0.0001) Right: schematic of what the MSDα values imply. (K) Representative time lapse of a microglia (grey) treated with activated PST-1 and tracked (magenta), showing how microglia migrate towards apoptotic targets (yellow asterisk). Boxplots depict mean +/- min to max values. Groups were compared using a two-tailed, nonparametric Mann-Whitney U-test was used (C, E, H, J). When comparing reapeated measurements from the same group, a nonparametric Friedmann test with a Dunn's correction was used (G). N refers to the number of zebrafish and n to the number of microglia examined.
|