
Figure 2
- ID
- ZDB-IMAGE-221211-101
- Publication
- Möller et al., 2022 - A role for the centrosome in regulating the rate of neuronal efferocytosis by microglia in vivo
- All Figures
- Figures for Möller et al., 2022
|
Figure 2
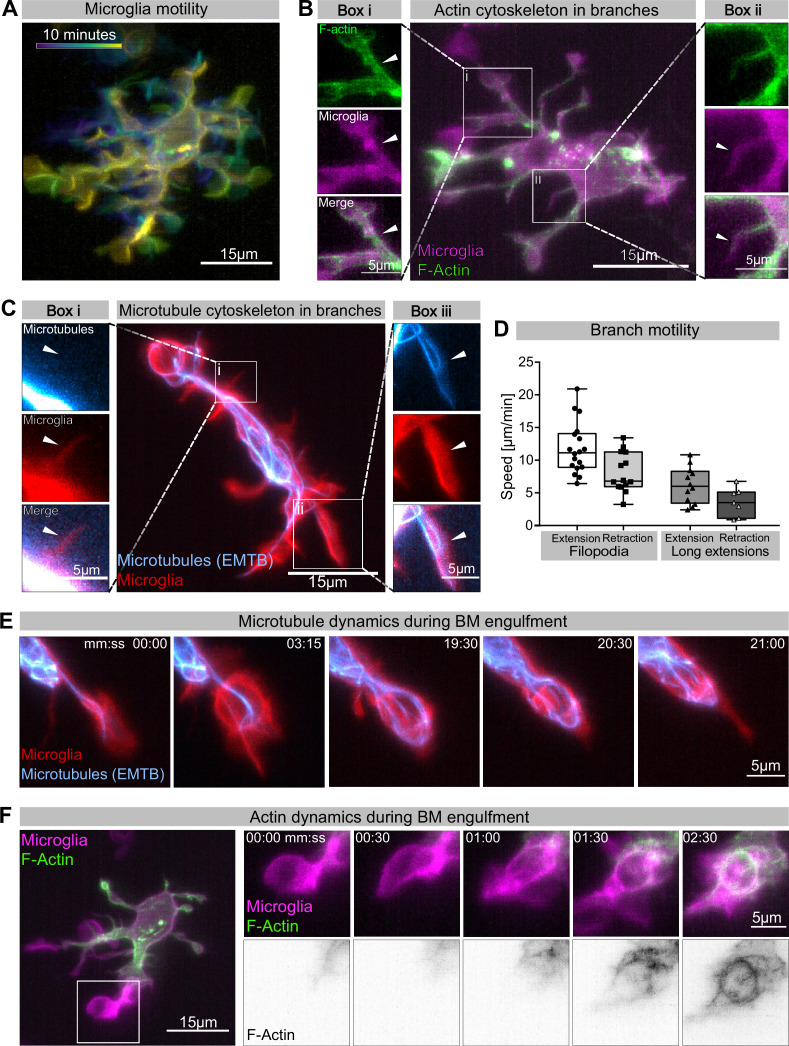
(A) Colour-coded overlay of a 10 min time lapse of microglia Tg(mpeg1:Gal4; UAS:lyn-tagRFPt) showing their branch dynamics. (B) Microglia (magenta; Tg(mpeg1:Gal4; UAS:lyn-tagRFPt)) and F-actin (green; UAS:UtrCH-mNG). Box i shows thicker extensions, and box ii shows thin filopodia, both containing F-actin. (C) Microglia (red; Tg(csf1ra:GAL4-VP16; UAS:lyn-tagRFPt)) and microtubules (cyan; Tg(UAS:EMTB-3xGFP)). Box i shows a thin filopodia, and box ii shows a thicker extension; microtubules are only observed in thicker extensions. The intensity histogram of images in boxes i and ii from (B) and (C) has been adjusted to highlight the weak fluorescent signals of the cytoskeletal components. (D) The speed at which both thick extensions and thin filopodia extend and retract, measured in μm/min (n = 2, 2–10 retractions/extensions analysed per microglia, boxplot depict mean +/- min to max values). (E) The panel shows the same branch as in (C) box ii at a later time point, forming a phagosome. (F) Microglia (magenta; Tg(mpeg1:Gal4; UAS:lyn-tagRFPt)) and F-actin (green; (UAS:UtrCH-mNG)). The panel shows how F-actin is found in the cellular extension and engages with the phagosome soon after this has formed. Full time lapse is found in Figure 2—video 1. n refers to the number of microglia examined.
Cytoskeletal dynamics during microglia efferocytosis.