
- Title
-
In Vitro and In Vivo Biological Activity of Ruthenium 1,10-Phenanthroline-5,6-dione Arene Complexes
- Authors
- Lenis-Rojas, O.A., Roma-Rodrigues, C., Carvalho, B., Cabezas-Sainz, P., Fernández Vila, S., Sánchez, L., Baptista, P.V., Fernandes, A.R., Royo, B.
- Source
- Full text @ Int. J. Mol. Sci.
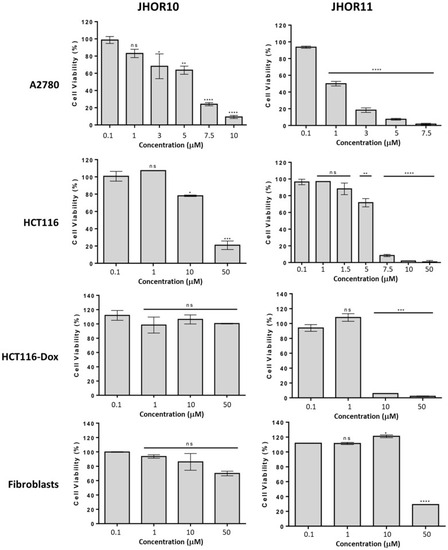
Antiproliferative activity of JHOR10 and JHOR11 after 48 h in A2780, HCT116 and Doxorubicin-resistant HCT116 (HCT116-Dox) cell lines and in normal human dermal fibroblasts. Data were normalized to the control (0.1% (v/v) DMSO) with bars representing the mean ± SD of at least three independent experiments. * p value < 0.05, ** p value < 0.01, *** p value < 0.005, **** p value < 0.0001, n.s. not significant. |
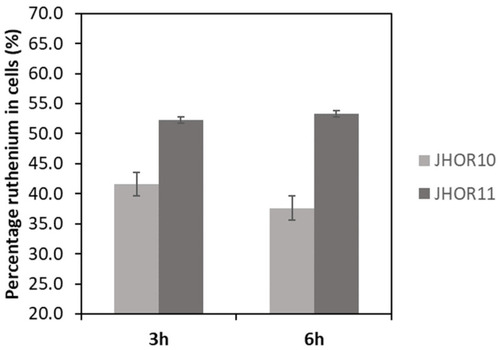
Internalization of JHOR10 and JHOR11 in A2780 cell line. Cells were incubated for 3 h and 6 h in the presence of 10 µM of each complex and the percentage of Ru within cells analyzed by ICP-AES. |

Percentage of apoptotic A2780 cells after 48 h exposure to IC50 concentration of JHOR11 evaluated by flow cytometry. DMSO 0.1% (v/v) was the vehicle control and cisplatin 3.5 μM was used as positive control. Bars represent the mean ± SD of at least three independent experiments. * p value < 0.05. |
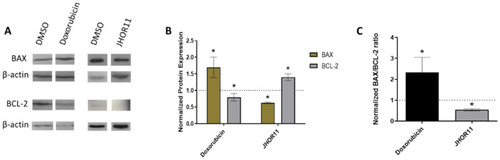
Quantification of apoptotic index of A2780 cells. (A) Western blot for quantification of BAX, BCL-2 and β-actin in A2780 cells after 48 h incubation with IC50 of JHOR11, 0.1 μM Doxorubicin as positive control or 0.1% (v/v) DMSO (control). (B) BAX and BCL-2 protein expression after normalization to respective β-actin and control. The value of the control is represented as a dotted line. (C) Apoptotic index calculated by BAX/BCL-2 ratio. The value of the control is 1, represented as a dotted line. Bars represent the average ± SD of three independent experiments. * p value < 0.05 relative to control. |
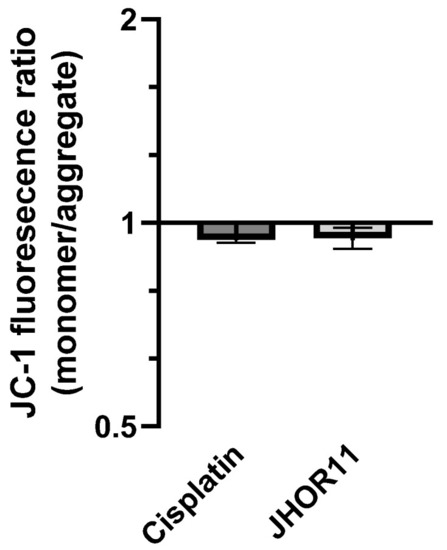
Mitochondrial potential evaluated by the JC-1 monomer/aggregate fluorescence ratio after 48 h incubation of A2780 cells with IC50 of JHOR11. DMSO (0.1% (v/v)) was the vehicle control and cisplatin 3.5 µM was used as the positive control. Data were normalized to the vehicle control, and bars represent the mean ± SD of at least three independent experiments. |

Percentage of live and dead A2780 cells in the supernatant or adherent after 48 h of exposure to the IC50 of JHOR11, or to a concentration 10 times higher than the IC50 of JHOR11 (10 × IC50), or to a concentration 10 times lower than the IC50 of JHOR11 (1/10 IC50). |
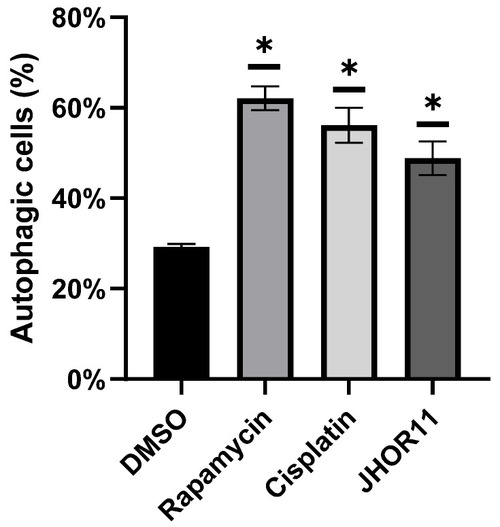
Percentage of autophagic cells after 48 h exposure of A2780 cells to IC50 concentration of JHOR11, 0.1% (v/v) DMSO (vehicle control), 3.5 μM cisplatin and 1.5 μM rapamycin (positive controls). Bars represent the average ± SD of at least three independent experiments. * p value < 0.05 relative to vehicle control. |
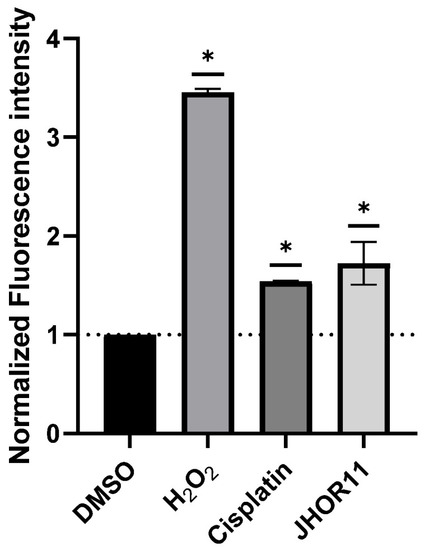
Production of reactive oxygen species (ROS) in A2780 after 48 h exposure to IC50 of complex JHOR11, 0.1% (v/v) DMSO for vehicle control, 25 μM H2O2 and 3.5 μM cisplatin as positive controls. Bars represent the average ± SD of at least three independent experiments of the fluorescence intensity normalized to fluorescence intensity of the vector control, represented as a dotted line. * p value < 0.05. |
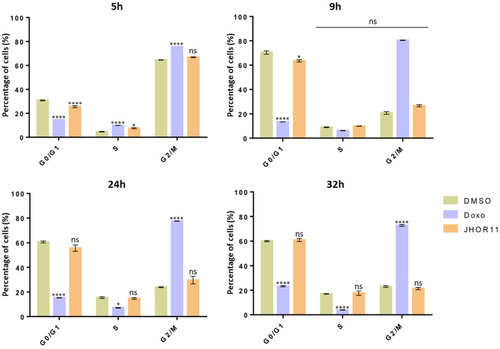
Analysis of the cell cycle for 5 h, 9 h, 24 h or 32 h of A2780 cells after exposure to IC50 of complex JHOR11, 0.1% (v/v) DMSO as vehicle control or 0.1 µM doxorubicin (Doxo) as positive control. Bars represent the average ± SD of at least three independent experiments. * p value < 0.05, **** p value < 0.001, n.s.—not significant relative to respective vehicle control sample. |

Quantification of senescent A2780 cells after 48 h incubation with IC50 of complex JHOR11, 0.1% (v/v) DMSO as vehicle control, 3.5 μM cisplatin and 0.1 μM doxorubicin as positive control. Bars represent the average ± SD. * p value < 0.05 relative to control. |
Percentage of wound scratch closure after 24 h incubation with IC50 JHOR11 and 0.1% (v/v) DMSO, as a vector control. Bars represent the mean ± SEM of two independent experiments. n.s.—p value not significant. |
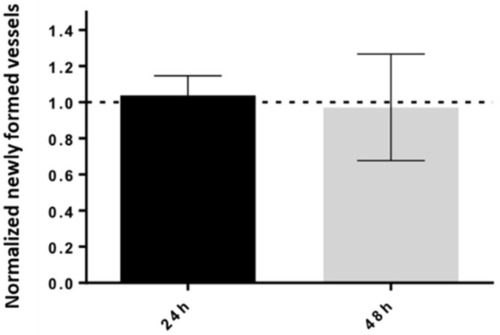
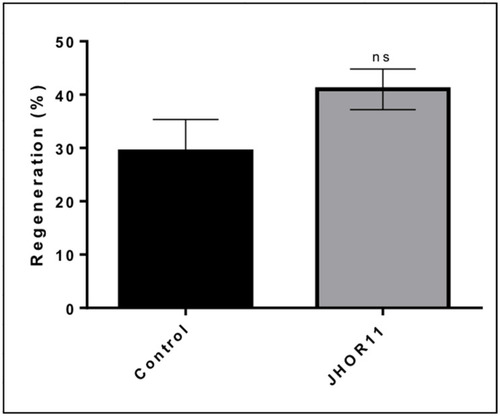
Newly formed vessels after 24 h and 48 h incubation with IC50 of JHOR11. Values are normalized to the number of vessels at 0 h and obtained after incubation with 0.1% (v/v) DMSO at the respective time point in the same embryo. The dotted line at 1.0 represents the value of the DMSO sample normalized to the respective number of vessels at a 0 h time point. Bars represent the average ± SD of six chicken embryos (biological independent assays). |

Zebrafish survival in presence of JHOR10 and JHOR11. (A) Zebrafish embryo survival when the JHOR10 compound was dissolved in the water. (B) Zebrafish embryo survival when the JHOR11 compound was dissolved in the water. |
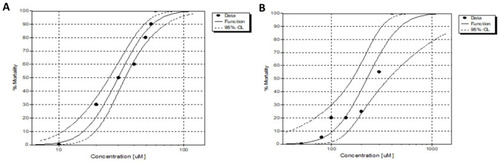
Mortality concentration–effect curve. (A) Concentration–effect curve showing the influence of JHOR10 on the mortality of the zebrafish observed after 96 h. (B) Concentration–effect curve showing the influence of JHOR11 on the mortality of the zebrafish observed after 96 h. |
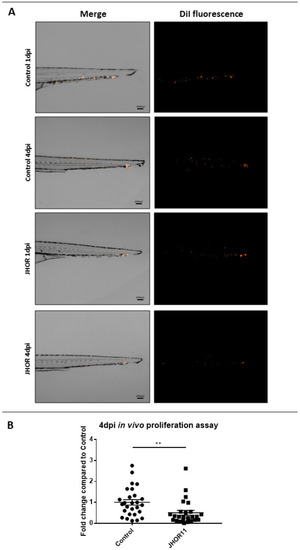
In vivo xenograft assays of human HCT116 colorectal cancer cell line with the JHOR11 (JHOR) treatment. (A) Representative images of the tail region of the zebrafish embryos (caudal hematopoietic tissue—CHT) where the DiI HCT116 labelled cells metastasize and proliferate at 1 dpi and 4 dpi for comparison. Main images are a superposition of a fluorescence image and a bright field image of the same embryo. Fluorescence images shows only the labelled cells of the main image. Scale = 250 µm. (B) Proliferation analysis based on the images taken at 4 dpi compared with the ones at 1 dpi, representing the fold change normalized to the control condition (ntotal = 25 embryos/condition, 3 replicates). (** p value = 0.062). |