
Image
|
Figure Caption
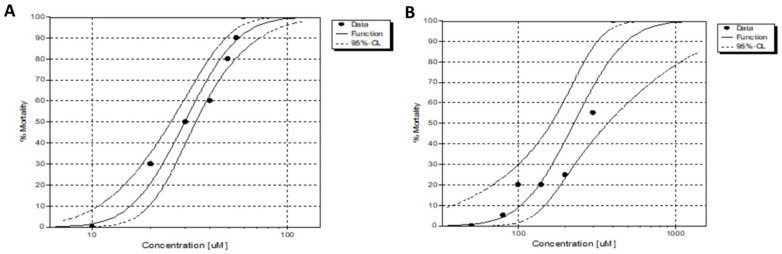
Fig. 14
Mortality concentration–effect curve. (A) Concentration–effect curve showing the influence of JHOR10 on the mortality of the zebrafish observed after 96 h. (B) Concentration–effect curve showing the influence of JHOR11 on the mortality of the zebrafish observed after 96 h.
Acknowledgments
This image is the copyrighted work of the attributed author or publisher, and
ZFIN has permission only to display this image to its users.
Additional permissions should be obtained from the applicable author or publisher of the image.
Full text @ Int. J. Mol. Sci.