
Image
|
Figure Caption
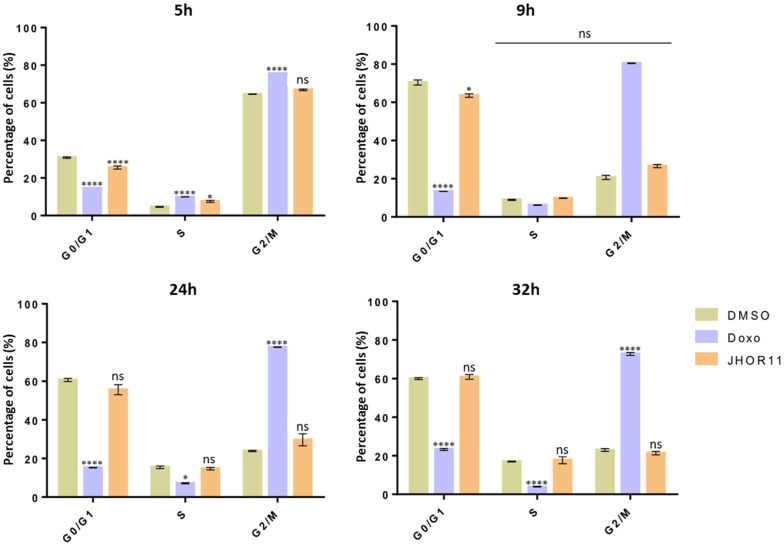
Fig. 9
Analysis of the cell cycle for 5 h, 9 h, 24 h or 32 h of A2780 cells after exposure to IC50 of complex JHOR11, 0.1% (v/v) DMSO as vehicle control or 0.1 µM doxorubicin (Doxo) as positive control. Bars represent the average ± SD of at least three independent experiments. * p value < 0.05, **** p value < 0.001, n.s.—not significant relative to respective vehicle control sample.
Acknowledgments
This image is the copyrighted work of the attributed author or publisher, and
ZFIN has permission only to display this image to its users.
Additional permissions should be obtained from the applicable author or publisher of the image.
Full text @ Int. J. Mol. Sci.