
Image
|
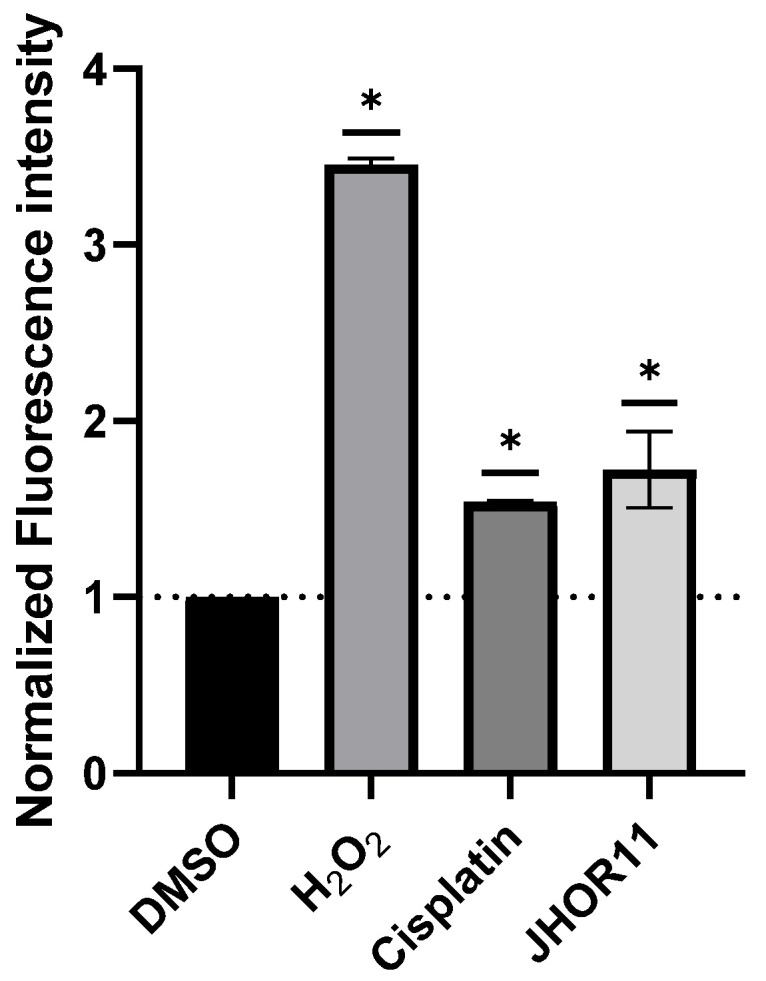
Figure Caption
Fig. 8
Production of reactive oxygen species (ROS) in A2780 after 48 h exposure to IC50 of complex JHOR11, 0.1% (v/v) DMSO for vehicle control, 25 μM H2O2 and 3.5 μM cisplatin as positive controls. Bars represent the average ± SD of at least three independent experiments of the fluorescence intensity normalized to fluorescence intensity of the vector control, represented as a dotted line. * p value < 0.05.
Acknowledgments
This image is the copyrighted work of the attributed author or publisher, and
ZFIN has permission only to display this image to its users.
Additional permissions should be obtained from the applicable author or publisher of the image.
Full text @ Int. J. Mol. Sci.