
|
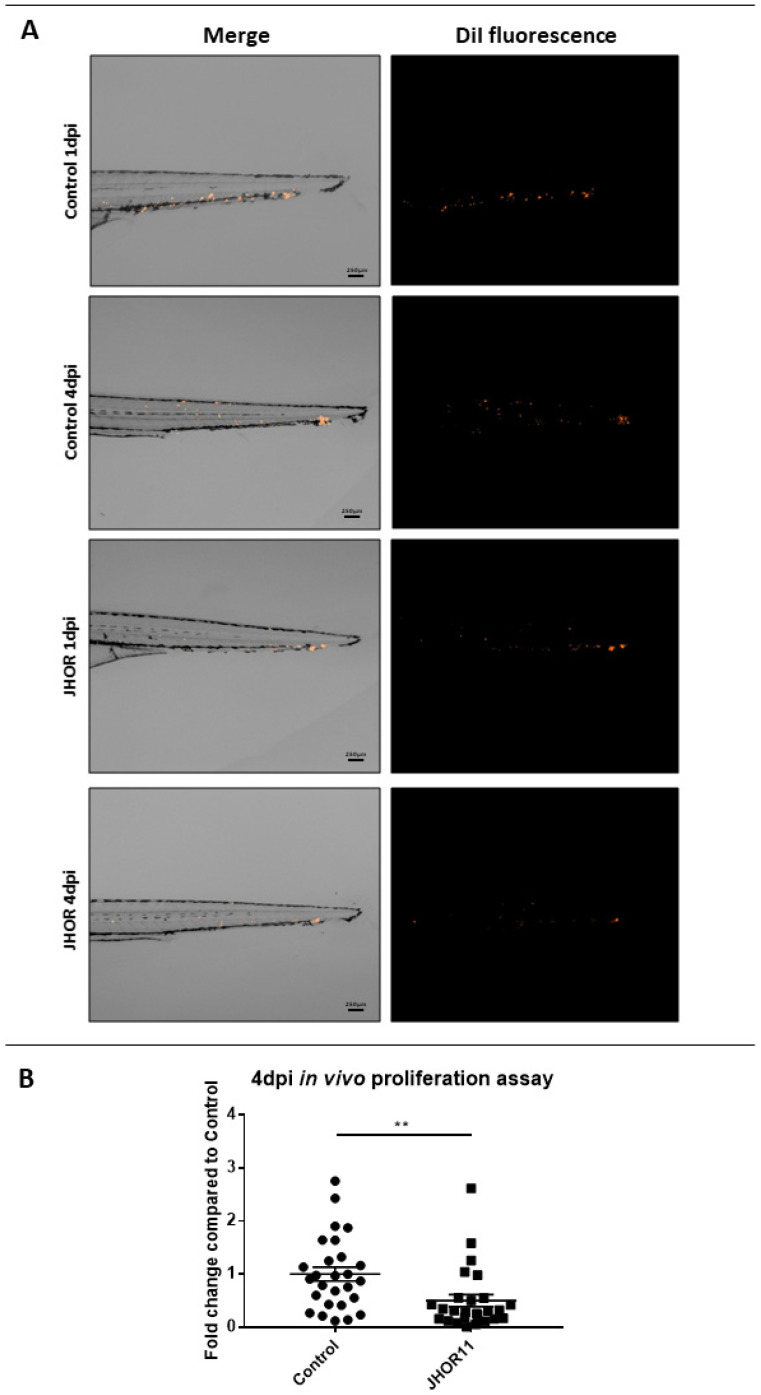
Fig. 15
In vivo xenograft assays of human HCT116 colorectal cancer cell line with the JHOR11 (JHOR) treatment. (A) Representative images of the tail region of the zebrafish embryos (caudal hematopoietic tissue—CHT) where the DiI HCT116 labelled cells metastasize and proliferate at 1 dpi and 4 dpi for comparison. Main images are a superposition of a fluorescence image and a bright field image of the same embryo. Fluorescence images shows only the labelled cells of the main image. Scale = 250 µm. (B) Proliferation analysis based on the images taken at 4 dpi compared with the ones at 1 dpi, representing the fold change normalized to the control condition (ntotal = 25 embryos/condition, 3 replicates). (** p value = 0.062).