
FIGURE
Fig. 12
- ID
- ZDB-FIG-230416-133
- Publication
- Lenis-Rojas et al., 2022 - In Vitro and In Vivo Biological Activity of Ruthenium 1,10-Phenanthroline-5,6-dione Arene Complexes
- Other Figures
- All Figure Page
- Back to All Figure Page
Fig. 12
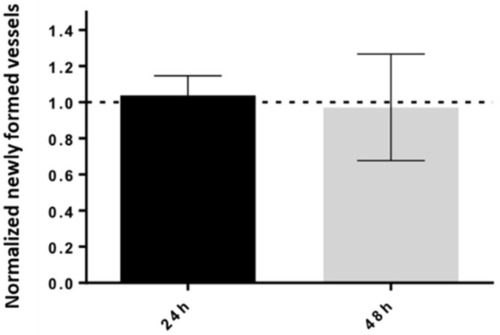
Newly formed vessels after 24 h and 48 h incubation with IC50 of JHOR11. Values are normalized to the number of vessels at 0 h and obtained after incubation with 0.1% (v/v) DMSO at the respective time point in the same embryo. The dotted line at 1.0 represents the value of the DMSO sample normalized to the respective number of vessels at a 0 h time point. Bars represent the average ± SD of six chicken embryos (biological independent assays). |
Expression Data
Expression Detail
Antibody Labeling
Phenotype Data
Phenotype Detail
Acknowledgments
This image is the copyrighted work of the attributed author or publisher, and
ZFIN has permission only to display this image to its users.
Additional permissions should be obtained from the applicable author or publisher of the image.
Full text @ Int. J. Mol. Sci.