
- Title
-
Hoxa9/meis1-transgenic zebrafish develops acute myeloid leukaemia-like disease with rapid onset and high penetrance
- Authors
- Wang, W., Li, H., Huang, M., Wang, X., Li, W., Qian, X., Jing, L.
- Source
- Full text @ Open Biol.
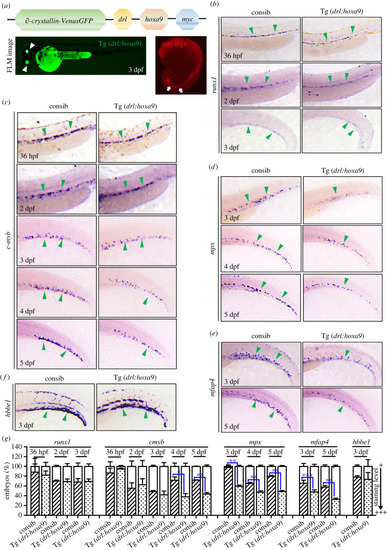
Transgenic zebrafish express hoxa9 under the control of drl regulatory element. (a) The schematic representation of Tg(drl:hoxa9) expression with ∂-crystallin::Venus GFP reporter gene. A GFP variant is expressed in the eyes under the control of the ∂-crystallin lens promoter (white arrowheads). Whole-mount immunofluorescence staining with anti-myc antibody indicated the overexpression of hoxa9 in blood cells (white arrows). (b) WISH assay for HSC gene, runx1 in embryos at 36 hpf-3 dpf. (c) WISH for myeloid progenitor gene, c-myb in embryos at 36 hpf-5 dpf. (d) WISH for neutrophil gene, mpx in embryos at 3–5 dpf. (e) WISH for macrophage gene, mfap4 in embryos 3–5 dpf. (f) WISH for erythroid gene, hbbe1 in embryos 3 dpf. (g) Quantification of WISH results in (b–f) at 36 hpf-5 dpf (n = 50–200 embryos per group). Data are represented as mean ± s.d. *p < .05, **p < .01, ***p < .001. drl, draculin; FLM, fluorescence microscopy; WISH, whole-mount in situ hybridization; hpf, hours post-fertilization; dpf, days post-fertilization. |
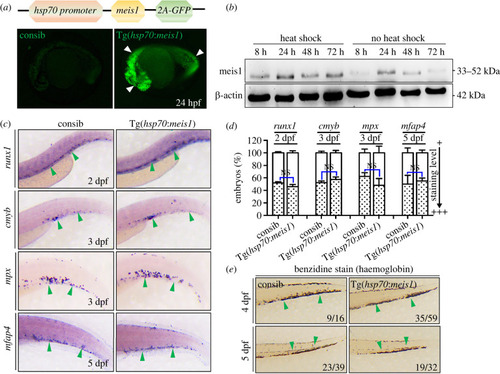
Transgenic zebrafish with inducible expression of meis1 under the control of hsp70 promoter. (a) The schematic representation of Tg(hsp70:meis1) expression vector. Ubiquitous GFP expression can be observed throughout whole embryos followed by HS for 1 h at 24 hpf (white arrowheads). (b) Western blot using a monoclonal anti-Meis1 antibody recognizes Meis1 protein at different times after HS induction. The antibody also recognizes endogenous Meis1 protein in the control group without HS. The mouse anti-β-actin antibody serves as controls. (c) Tg(hsp70:meis1) embryos were heat shocked at 24 hpf and assayed by WISH for runx1 (2 dpf), c-myb (3 dpf), mpx (3 dpf) and mfap4 (5 dpf) at different stages. (d) The quantification of WISH results in C (n = 50–100 embryos per group). Data are represented as mean ± s.d. NS means no statistical significance. (e) Benzidine staining of haemoglobin in mature erythrocytes in embryos at 4–5 dpf. HS, heat-shock. dpf, days post-fertilization. |
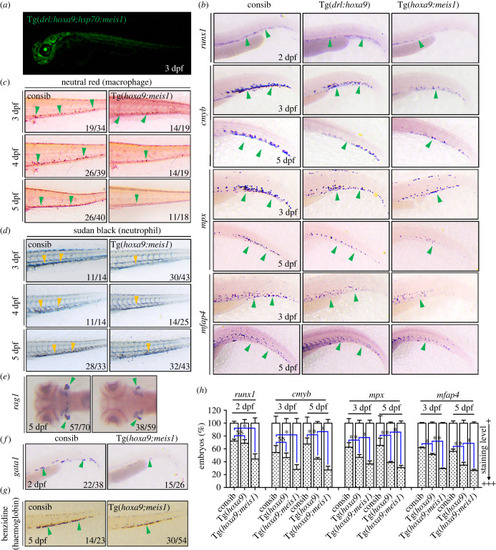
Tg(drl:hoxa9;hsp70:meis1) inhibits myeloid, erythroid and lymphoid differentiation and the formation of HSCs and myeloid progenitors. (a) Tg(drl:hoxa9;hsp70:meis1) was heat shocked at 24 hpf, and ubiquitous GFP expression was induced after HS. GFP was also expressed in the eyes under the control of the ∂-crystallin promoter. (b) Tg(drl:hoxa9;hsp70:meis1) embryos and control siblings were heat shocked at 24 hpf and assayed by WISH for different genes in zebrafish haematopoiesis at different stages, runx1 (2 dpf), c-myb (3 and 5 dpf), mpx (3 and 5 dpf) and mfap4 (3 and 5 dpf). (c) Neutral red staining of macrophages in embryos at 3–5 dpf. (d) Sudan black staining of neutrophils in embryos at 3–5 dpf. (e) WISH assay for rag1 at 5 dpf. (f) WISH assay for erythroid gene, gata1 in embryos at 2 dpf. (g) Benzidine staining of haemoglobin in mature erythrocytes in embryos at 5 dpf. (h) The quantification of WISH results in (b) (n = 50–100 embryos per group). Data are represented as mean ± s.d. *p < .05, **p < .01. NS means no statistical significance. HS, heat-shock; dpf, days post-fertilization; WISH, whole-mount in situ hybridization. |
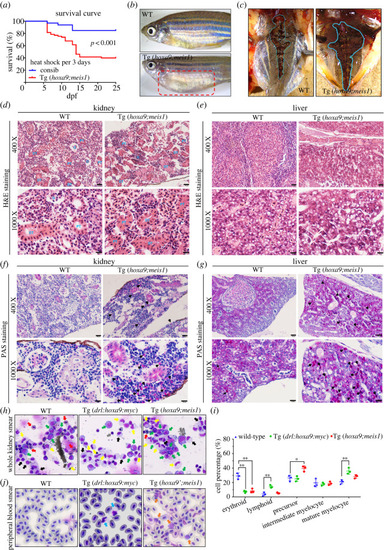
Tg(drl:hoxa9;hsp70:meis1) zebrafish develop disease similar to AML. (a) Survival curves of control and Tg(drl:hoxa9;hsp70:meis1) fish after heat-shock induction every 3 days starting at 24 hpf, n = 30–60, p < 0.001, Log-rank (Mantel-Cox) significance test. (b) Tg(drl:hoxa9;hsp70:meis1) embryos were heat shocked every 3 days starting at 24 hpf and then grown to adulthood. At 3 months old, many Tg(drl:hoxa9;hsp70:meis1) presented with abdominal masses and were susceptible to infection. (c) Gross anatomy of Tg(drl:hoxa9;hsp70:meis1) and WT kidneys (about 3 months old). (d,e) High-magnification imaging of H&E-stained tissue sections of WT and Tg(drl:hoxa9/meis1) kidneys and livers (400 x, scale bar = 20 µM and 1000 x, scale bar = 10 µM). The affected kidneys and livers showed the absence of normal tissue structures and presence of disorganized infiltrate. PT: proximal tubule, DT: distal tubule, G: glomerus. (f,g) High-magnification imaging of PAS-stained tissue sections of WT and Tg(drl:hoxa9;hsp70:meis1) kidneys and livers (400 x, scale bar = 20 µM and 1000 x, scale bar = 10 µM). Black arrows indicate PAS ± -granulocytic myeloid cells. (h) May-Grünwald and Giemsa staining of the whole KM of 3-month-old WT, Tg(drl:hoxa9) and Tg(drl:hoxa9;hsp70:meis1). The expanded precursors were detected in Tg(drl:hoxa9;hsp70:meis1) (green arrows). Red arrows indicate erythroid cells. Grey arrows indicate lymphoid cells. Black arrows indicate mediate-differentiation cells. Yellow arrows indicate fully differentiation cells. (i) Statistical analysis of various haematopoietic cells from whole KM of WT, Tg(drl:hoxa9) and Tg(drl:hoxa9;hsp70:meis1) fish. (j) May-Grünwald and Giemsa staining of the PB smear of 3-month-old WT, Tg(drl:hoxa9) and Tg(drl:hoxa9;hsp70:meis1). Blue arrows indicate the infiltration of mature myeloid cells into PB in Tg(drl:hoxa9). Orange arrows indicate the infiltration of myelomonocytes and precursors into PB in Tg(drl:hoxa9;hsp70:meis1). Data are represented as mean ± s.d. *p < .05, **p < .01, ***p < .001. H&E, haematoxylin & eosin; PAS, periodic acid-Schiff. |
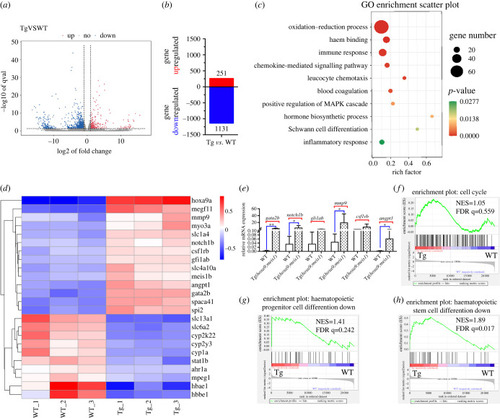
Genome-wide transcriptional analysis of the KM cell of WT and Tg(drl:hoxa9;hsp70:meis1) adult fish. (a) The volcano plot for differential gene expression between WT and Tg(drl:hoxa9;hsp70:meis1) from three biological replicates. (b) Numbers of up- and downregulated genes in Tg(drl:hoxa9;hsp70:meis1) relative to WT (greater than twofold change, adj p ≤ 0.05). (c) GO enrichment analysis of differential expressed genes. (d) Heatmap display of the representative differentially expressed genes between WT and Tg(drl:hoxa9;hsp70:meis1). (e) qPCR assay on the mRNA levels of a number of genes in KW cells in Tg(drl:hoxa9;hsp70:meis1) compared to WT. Data are represented as mean ± s.d. *p < .05, **p < .01. (f–h) GSEA of the expressing profile of KM cells in WT and Tg(drl:hoxa9;hsp70:meis1) using cell cycle-associated upregulated signature, haematopoietic progenitor cell differentiation-associated downregulated signature and HSC differentiation-associated downregulated signature. KW, kidney marrow. |
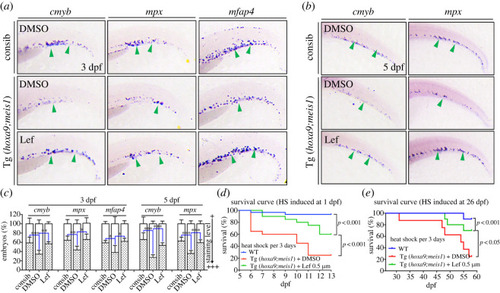
DHODH inhibitor leflunomide rescues defective haematopoiesis and improves the survival in Tg(drl:hoxa9;hsp70:meis1) fish. (a,b) Tg(drl:hoxa9;hsp70:meis1) embryos and control siblings were heat-shock induced at 24 hpf. Tg(drl:hoxa9;hsp70:meis1) embryos were treated with DMSO or Lef after heat shock. Embryos were assayed by WISH for the expression of cmyb, mpx and mfap4 at 3 dpf or 5 dpf. (c) Quantification of WISH results in (a,b) (n = 50–100 embryos per group). Data are represented as mean ± s.d. *p < .05, **p < .01, ***p < .001. (d) WT and Tg(drl:hoxa9;hsp70:meis1) were repeatedly heat-shock induced starting from 24 hpf, Tg(drl:hoxa9;hsp70:meis1) fish were treated with DMSO or Lef after the initial heat shock. Survival curves of WT and Tg(drl:hoxa9;hsp70:meis1) fish (n = 20–30 per group, Log-rank (Mantel-Cox) significance test). (e) WT and Tg(drl:hoxa9;hsp70:meis1) were repeatedly heat shock induced starting from 26 dpf, Tg(drl:hoxa9;hsp70:meis1) fish were treated with DMSO or Lef after the initial heat shock. Survival curves of WT and Tg(drl:hoxa9;hsp70:meis1) fish (n = 10 per group, Log-rank (Mantel-Cox) significance test). Lef, Leflunomide; hpf, hours post-fertilization; dpf, days post-fertilization. |