
Figure 4.
- ID
- ZDB-FIG-221030-21
- Publication
- Wang et al., 2022 - Hoxa9/meis1-transgenic zebrafish develops acute myeloid leukaemia-like disease with rapid onset and high penetrance
- Other Figures
- All Figure Page
- Back to All Figure Page
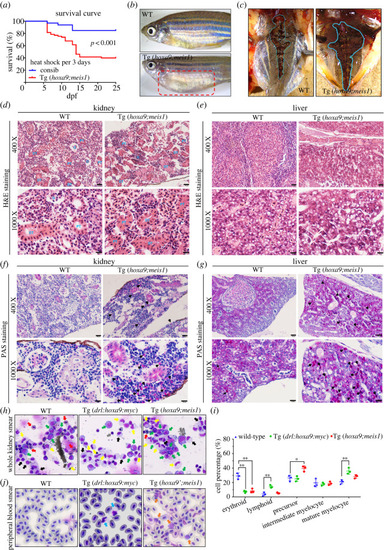
Tg(drl:hoxa9;hsp70:meis1) zebrafish develop disease similar to AML. (a) Survival curves of control and Tg(drl:hoxa9;hsp70:meis1) fish after heat-shock induction every 3 days starting at 24 hpf, n = 30–60, p < 0.001, Log-rank (Mantel-Cox) significance test. (b) Tg(drl:hoxa9;hsp70:meis1) embryos were heat shocked every 3 days starting at 24 hpf and then grown to adulthood. At 3 months old, many Tg(drl:hoxa9;hsp70:meis1) presented with abdominal masses and were susceptible to infection. (c) Gross anatomy of Tg(drl:hoxa9;hsp70:meis1) and WT kidneys (about 3 months old). (d,e) High-magnification imaging of H&E-stained tissue sections of WT and Tg(drl:hoxa9/meis1) kidneys and livers (400 x, scale bar = 20 µM and 1000 x, scale bar = 10 µM). The affected kidneys and livers showed the absence of normal tissue structures and presence of disorganized infiltrate. PT: proximal tubule, DT: distal tubule, G: glomerus. (f,g) High-magnification imaging of PAS-stained tissue sections of WT and Tg(drl:hoxa9;hsp70:meis1) kidneys and livers (400 x, scale bar = 20 µM and 1000 x, scale bar = 10 µM). Black arrows indicate PAS ± -granulocytic myeloid cells. (h) May-Grünwald and Giemsa staining of the whole KM of 3-month-old WT, Tg(drl:hoxa9) and Tg(drl:hoxa9;hsp70:meis1). The expanded precursors were detected in Tg(drl:hoxa9;hsp70:meis1) (green arrows). Red arrows indicate erythroid cells. Grey arrows indicate lymphoid cells. Black arrows indicate mediate-differentiation cells. Yellow arrows indicate fully differentiation cells. (i) Statistical analysis of various haematopoietic cells from whole KM of WT, Tg(drl:hoxa9) and Tg(drl:hoxa9;hsp70:meis1) fish. (j) May-Grünwald and Giemsa staining of the PB smear of 3-month-old WT, Tg(drl:hoxa9) and Tg(drl:hoxa9;hsp70:meis1). Blue arrows indicate the infiltration of mature myeloid cells into PB in Tg(drl:hoxa9). Orange arrows indicate the infiltration of myelomonocytes and precursors into PB in Tg(drl:hoxa9;hsp70:meis1). Data are represented as mean ± s.d. *p < .05, **p < .01, ***p < .001. H&E, haematoxylin & eosin; PAS, periodic acid-Schiff. |