
Figure 5.
- ID
- ZDB-IMAGE-221030-24
- Publication
- Wang et al., 2022 - Hoxa9/meis1-transgenic zebrafish develops acute myeloid leukaemia-like disease with rapid onset and high penetrance
- All Figures
- Figures for Wang et al., 2022
|
Figure 5
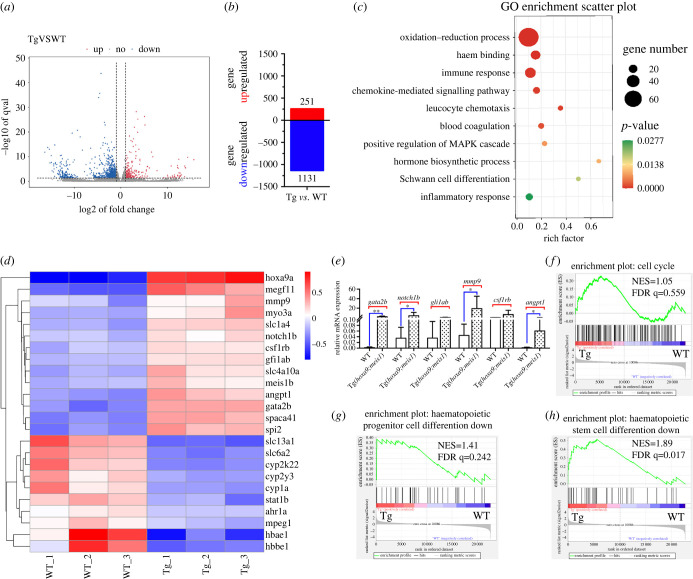
Genome-wide transcriptional analysis of the KM cell of WT and Tg(drl:hoxa9;hsp70:meis1) adult fish. (a) The volcano plot for differential gene expression between WT and Tg(drl:hoxa9;hsp70:meis1) from three biological replicates. (b) Numbers of up- and downregulated genes in Tg(drl:hoxa9;hsp70:meis1) relative to WT (greater than twofold change, adj p ≤ 0.05). (c) GO enrichment analysis of differential expressed genes. (d) Heatmap display of the representative differentially expressed genes between WT and Tg(drl:hoxa9;hsp70:meis1). (e) qPCR assay on the mRNA levels of a number of genes in KW cells in Tg(drl:hoxa9;hsp70:meis1) compared to WT. Data are represented as mean ± s.d. *p < .05, **p < .01. (f–h) GSEA of the expressing profile of KM cells in WT and Tg(drl:hoxa9;hsp70:meis1) using cell cycle-associated upregulated signature, haematopoietic progenitor cell differentiation-associated downregulated signature and HSC differentiation-associated downregulated signature. KW, kidney marrow.