
- Title
-
15-keto-Prostaglandin E2 exhibits bioactive role by modulating glomerular cytoarchitecture through EP2/EP4 receptors
- Authors
- Kourpa, A., Kaiser-Graf, D., Sporbert, A., Philippe, A., Catar, R., Rothe, M., Mangelsen, E., Schulz, A., Bolbrinker, J., Kreutz, R., Panáková, D.
- Source
- Full text @ Life Sci.

Fig. 1. 15-keto-PGE2 binds EP receptors in vitro. (a) PGE2 degradation pathway highlighting the first synthesized metabolic product, 15-keto-PGE2. (b) Schematic of the experimental assay to measure receptor membrane expression using the Nano-Glo® HiBiT Extracellular Detection System. The HiBiT-tagged receptor is synthesized, processed and released from the endoplasmic reticulum (ER) and transported by secretory vesicles to the cell membrane. Yeast expressing HiBiT-tagged hEP2 or HibiT-tagged hEP4 receptors on the membrane were stimulated with either 100 nM PGE2, 1 μM 15-keto-PGE2 or equal volume of medium for non-stimulated controls for 20 min to allow ligand binding. Adding of Nano-Glo® HiBiT Extracellular Reagent (containing Buffer, substrate and LgBiT protein) generated luminescence by structural complementation of LgBiT proteins with extra-cellular displayed HiBiT-tags, and thus allowing quantification of the number of receptors in the membrane; N represents cell nucleus. Quantification graphs of the (c) HiBiT-tagged hEP2 and (d) HiBiT-tagged hEP4 receptors cell membrane expression after 20 min stimulation with PGE2 (dark grey) and 15-keto-PGE2 (light grey). Wilcoxon test and Mann-Whitney tests were performed. Values are plotted as mean ± SD; P < 0.05 considered significant. |
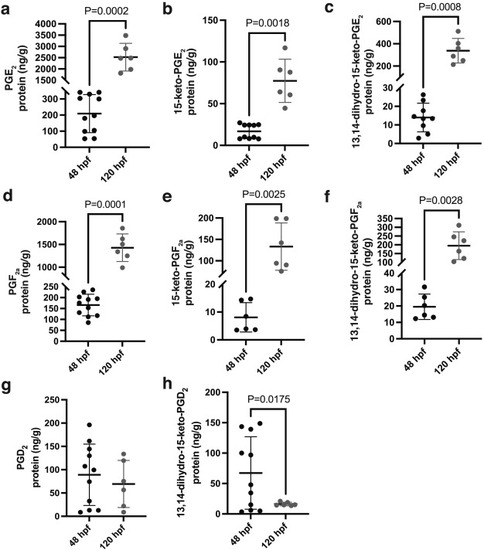
Fig. 2. Prostaglandin lipidomic profiles of developing zebrafish embryos. (a-h) Lipidomic analysis of whole zebrafish embryos at two different developmental stages (48 hpf and 120 hpf) showing the levels of the main prostaglandins and their metabolites: (a) PGE2 (P = 0.0002), (b) 15-keto-PGE2 (P = 0.0018), (c) 13,14-dihydro-15-keto-PGE2 (P = 0.0008), (d) PGF2a (P = 0.0001), (e) 15-keto-PGF2a (P = 0.0025), (f) 13,14-dihydro-15-keto-PGF2a (P = 0.0028), (g) PGD2 (P = 0.5006) and (h) 13,14-dihydro-15-keto-PGD2 (P = 0.0175). For 48 hpf: N = 11, n = 275 (less points in some of the graphs indicate missing values due to non-detectable levels). For 120 hpf: N = 6, n = 150. For all graphs, two-tailed unpaired t-test with Welch’s correction was performed. Values are plotted as mean ± SD; P < 0.05 considered significant. |
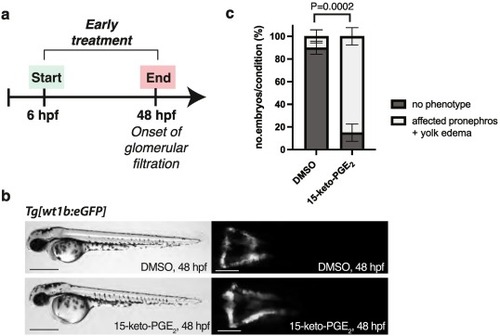
Fig. 3. Zebrafish pronephros is affected after early treatment with 15-keto-PGE2. (a) Experimental design of the early pharmacological treatment, starting from 6 hpf until 48 hpf. (b) Brightfield fluorescence microscopy images of Tg[wt1b:eGFP] embryos at 48 hpf, following pharmacological treatments with DMSO vehicle 0.88 % (upper panel) and 15-keto-PGE2 500 μM (lower panel). Scale bar: 500 μm for brightfield images and 200 μm for fluorescent images. (c) Phenotypic quantitative analysis of zebrafish embryos at 48 hpf. Embryos are categorized as “no phenotype” (pronephros morphology remains unaffected after DMSO treatment) or “affected pronephros + yolk edema” (kidney phenotype observed after exposure to 15-keto-PGE2); N = 3, n = 30 for both conditions; Percentage values are plotted as mean ± SD; n represents biologically independent samples over N independent experiments; Ordinary two-way ANOVA with Tukey's multiple comparison test (P = 0.0002); P < 0.05 considered significant. |
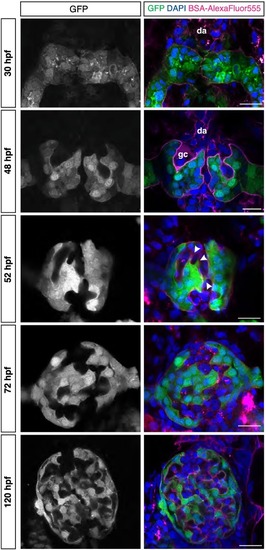
Fig. 4. Glomerular morphogenesis occurs in distinct steps. Zebrafish glomerular developmental stages. Representative high-resolution confocal microscopy images (single confocal section) of the Tg[wt1b:eGFP] developing zebrafish embryonic kidney at different developmental stages, 30 hpf (nephron primordia), 48 hpf, 52 hpf, 72 hpf and 120 hpf in an order from top to bottom. The podocytes and parietal epithelial cells in the glomeruli in grey (left), in green (in merge, right), endothelial cells of glomeruli capillaries in magenta (BSA-AlexaFluor555, in merge), cells nuclei in blue (DAPI, in merge). At 52 hpf, podocyte protrusions (arrowheads) start surrounding the capillaries to form the mature GFB. Dorsal aorta (da) and glomerular cleft (gc) are observed at the early developmental stages of the glomerulus. Scale bar = 10 μm. (For interpretation of the references to colour in this figure legend, the reader is referred to the web version of this article.) |

Fig. 5. 15-keto-PGE2 exposure affects podocyte intercalation process during glomerular vascularization. (a) Representative confocal microscopy images of Tg[wt1b:eGFP] zebrafish glomeruli at 48 hpf after DMSO vehicle 0.88 % and 15-keto-PGE2 500 μM treatment; N = 2, n = 5 for both conditions; dotted-line circle indicates podocyte consolidation and failure of normal elaboration around the continuously forming glomerular capillaries. (b) Quantification graph showing the percentage of imaged glomeruli with affected morphology at 48 hpf after exposure to DMSO (not affected morphology) and 15-keto-PGE2 (4 out of 5 imaged glomeruli showed affected morphology). (c) Representative confocal microscopy images of Tg[wt1b:eGFP] zebrafish glomeruli at 96 hpf after DMSO vehicle 0.88 % and 15-keto-PGE2 500 μM treatment; N = 3, n = 7 for DMSO and N = 3, n = 6 for 15-keto-PGE2; dotted-line circle indicates impaired podocyte intercalation around the formed capillaries. (d) Quantification graph showing the percentage of imaged glomeruli with affected morphology at 96 hpf after exposure to DMSO (not affected morphology) and 15-keto-PGE2 (5 out of 6 imaged glomeruli showed affected morphology). In all images, grey scale images show the podocytes and parietal epithelial cells in the glomeruli; in the merge podocytes and parietal epithelial cells are represented in green (eGFP), endothelial cells of glomeruli capillaries are marked in magenta (BSA-AlexaFluor555) and cells nuclei in blue (DAPI); Scale bar = 10 μm. (For interpretation of the references to colour in this figure legend, the reader is referred to the web version of this article.) |

Fig. 6. Combined pharmacological blockade of EP2 and EP4 receptors reverses the effect of 15-keto-PGE2 exposure. (a) Representative images of 2D surface segmentation and 3D glomerular reconstruction performed with Imaris software using the confocal microscopy images of Tg[wt1b:eGFP] zebrafish glomeruli at 96 hpf after pharmacological treatment with DMSO vehicle 0.96 % (top) (N = 3, n = 6), 15-keto-PGE2 500 μM (middle) (N = 3, n = 5), and 15-keto-PGE2 500 μM + PF-04418948 (EP2 receptor antagonist) 20 μM + ONO-AE3-208 (EP4 receptor antagonist) 20 μM (bottom) (N = 2, n = 7); n represents biologically independent samples over N independent experiments; Scale bar = 10 μm. (b-c) Quantitative graphs of the glomerular volume and surface area in the glomeruli analyzed for the different pharmacological treatment groups; Ordinary one-way ANOVA with Tukey's multiple comparison test was performed for both graphs; in graph (b): DMSO vs 15-keto-PGE2 (P = 0.1362), 15-keto-PGE2 vs 15-keto-PGE2 + PF-04418948 + ONO-AE3-208 (P = 0.2331), and DMSO vs 15-keto-PGE2 + PF-04418948 + ONO-AE3-208 (P = 0.9074); in graph (c): DMSO vs 15-keto-PGE2 (P = 0.0165), 15-keto-PGE2 vs 15-keto-PGE2 + PF-04418948 + ONO-AE3-208 (P = 0.0021), and DMSO vs 15-keto-PGE2 + PF-04418948 + ONO-AE3-208 (P = 0.6048); Values are plotted as mean ± SD; P < 0.05 considered significant. |