
|
Fig. 1
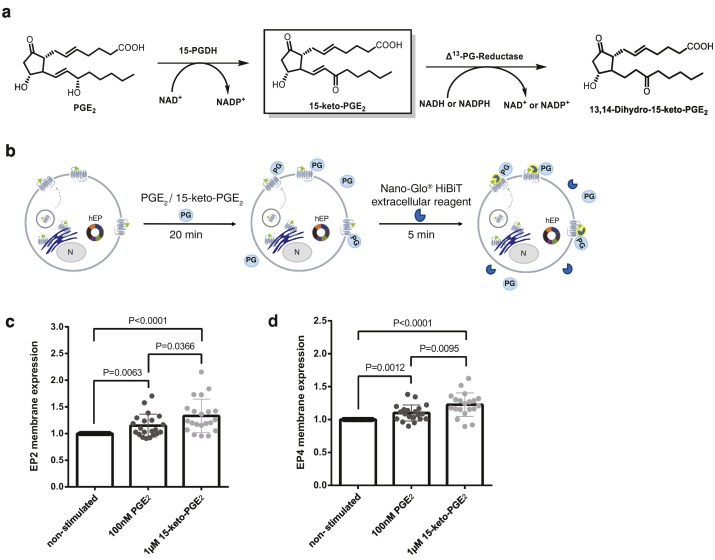
Fig. 1. 15-keto-PGE2 binds EP receptors in vitro. (a) PGE2 degradation pathway highlighting the first synthesized metabolic product, 15-keto-PGE2. (b) Schematic of the experimental assay to measure receptor membrane expression using the Nano-Glo® HiBiT Extracellular Detection System. The HiBiT-tagged receptor is synthesized, processed and released from the endoplasmic reticulum (ER) and transported by secretory vesicles to the cell membrane. Yeast expressing HiBiT-tagged hEP2 or HibiT-tagged hEP4 receptors on the membrane were stimulated with either 100 nM PGE2, 1 μM 15-keto-PGE2 or equal volume of medium for non-stimulated controls for 20 min to allow ligand binding. Adding of Nano-Glo® HiBiT Extracellular Reagent (containing Buffer, substrate and LgBiT protein) generated luminescence by structural complementation of LgBiT proteins with extra-cellular displayed HiBiT-tags, and thus allowing quantification of the number of receptors in the membrane; N represents cell nucleus. Quantification graphs of the (c) HiBiT-tagged hEP2 and (d) HiBiT-tagged hEP4 receptors cell membrane expression after 20 min stimulation with PGE2 (dark grey) and 15-keto-PGE2 (light grey). Wilcoxon test and Mann-Whitney tests were performed. Values are plotted as mean ± SD; P < 0.05 considered significant.