
|
Fig. 3
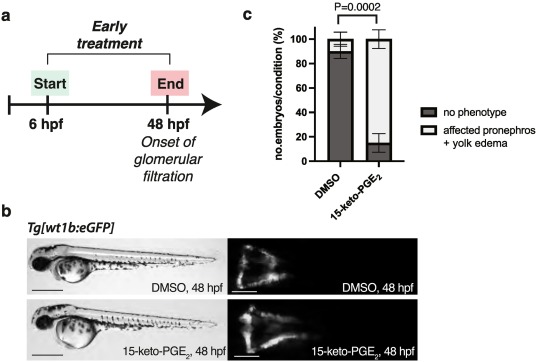
Fig. 3. Zebrafish pronephros is affected after early treatment with 15-keto-PGE2. (a) Experimental design of the early pharmacological treatment, starting from 6 hpf until 48 hpf. (b) Brightfield fluorescence microscopy images of Tg[wt1b:eGFP] embryos at 48 hpf, following pharmacological treatments with DMSO vehicle 0.88 % (upper panel) and 15-keto-PGE2 500 μM (lower panel). Scale bar: 500 μm for brightfield images and 200 μm for fluorescent images. (c) Phenotypic quantitative analysis of zebrafish embryos at 48 hpf. Embryos are categorized as “no phenotype” (pronephros morphology remains unaffected after DMSO treatment) or “affected pronephros + yolk edema” (kidney phenotype observed after exposure to 15-keto-PGE2); N = 3, n = 30 for both conditions; Percentage values are plotted as mean ± SD; n represents biologically independent samples over N independent experiments; Ordinary two-way ANOVA with Tukey's multiple comparison test (P = 0.0002); P < 0.05 considered significant.