
|
Fig. 6
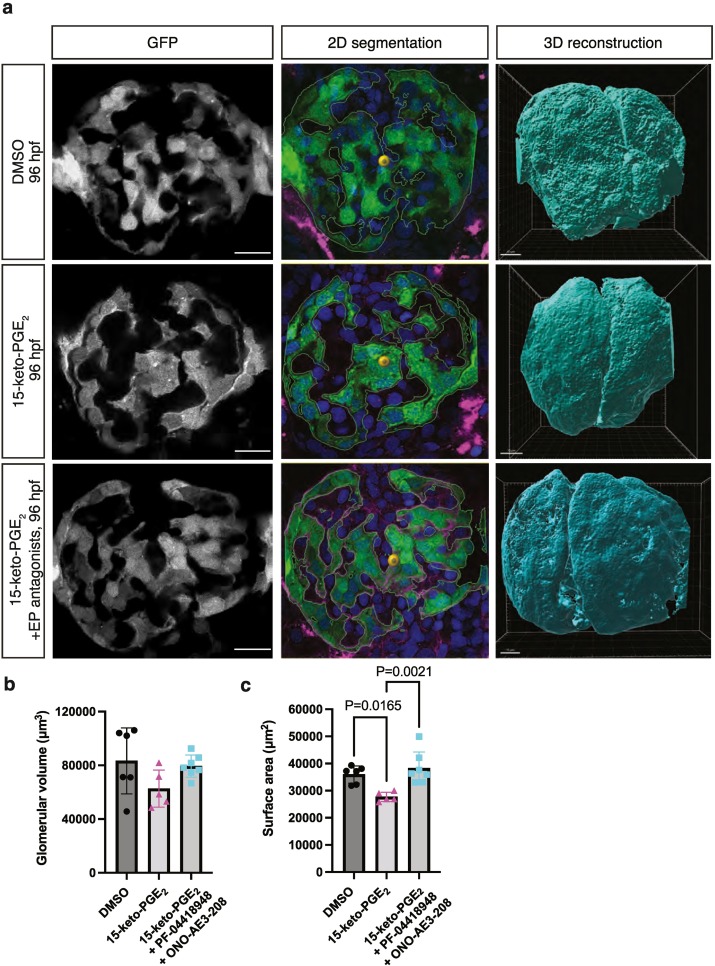
Fig. 6. Combined pharmacological blockade of EP2 and EP4 receptors reverses the effect of 15-keto-PGE2 exposure. (a) Representative images of 2D surface segmentation and 3D glomerular reconstruction performed with Imaris software using the confocal microscopy images of Tg[wt1b:eGFP] zebrafish glomeruli at 96 hpf after pharmacological treatment with DMSO vehicle 0.96 % (top) (N = 3, n = 6), 15-keto-PGE2 500 μM (middle) (N = 3, n = 5), and 15-keto-PGE2 500 μM + PF-04418948 (EP2 receptor antagonist) 20 μM + ONO-AE3-208 (EP4 receptor antagonist) 20 μM (bottom) (N = 2, n = 7); n represents biologically independent samples over N independent experiments; Scale bar = 10 μm. (b-c) Quantitative graphs of the glomerular volume and surface area in the glomeruli analyzed for the different pharmacological treatment groups; Ordinary one-way ANOVA with Tukey's multiple comparison test was performed for both graphs; in graph (b): DMSO vs 15-keto-PGE2 (P = 0.1362), 15-keto-PGE2 vs 15-keto-PGE2 + PF-04418948 + ONO-AE3-208 (P = 0.2331), and DMSO vs 15-keto-PGE2 + PF-04418948 + ONO-AE3-208 (P = 0.9074); in graph (c): DMSO vs 15-keto-PGE2 (P = 0.0165), 15-keto-PGE2 vs 15-keto-PGE2 + PF-04418948 + ONO-AE3-208 (P = 0.0021), and DMSO vs 15-keto-PGE2 + PF-04418948 + ONO-AE3-208 (P = 0.6048); Values are plotted as mean ± SD; P < 0.05 considered significant.