- Title
-
Lrpap1 deficiency leads to myopia through TGF-β-induced apoptosis in zebrafish
- Authors
- Liu, S., Chen, T., Chen, B., Liu, Y., Lu, X., Li, J.
- Source
- Full text @ Cell Commun. Signal.
|
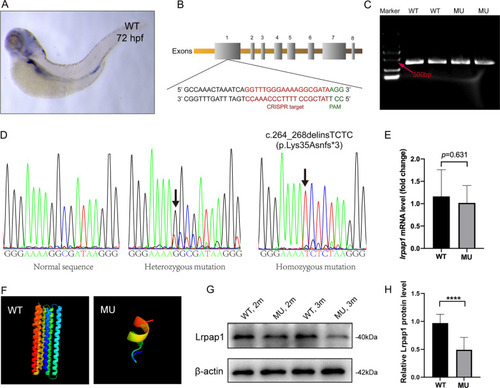
Generation of lrpap1 knockout zebrafish. A Representative image of a zebrafish embryo (72 hpf) subjected to whole-mount in situ hybridization targeting lrpap1. B The gRNA target and its corresponding position in the lrpap1 gene sequence are shown. C Agarose gel electrophoresis of the lrpap1 DNA amplified fragments. D DNA sequencing results of wild-type, heterozygous, and homozygous zebrafish; the 5 bp deletion/4 bp insertion mutation (c.262_266delinsTCTC) is highlighted by the black arrows. The mutation was predicted to cause a frameshift with premature translation termination, resulting in an abnormal protein (p.Lys35Asnfs*3). E lrpap1 mRNA expression was slightly decreased in the lrpap mutant lines, although this was not statistically significant (p = 0.631). F The protein structure of wild-type and mutant Lrpap1, as predicted by Phyre2. Image colored using the rainbow colors, from the N to C terminus. G Western blot analysis of the levels of Lrpap1 in the eyes of lrpap1 mutant and wild-type zebrafish two months and three months post-fertilization. H Relative quantitative result of Lrpap1 protein revealed that the Lrpap1 protein levels were markedly lower in mutant zebrafish than in the wild-type. n = 10 for wild-type zebrafish and n = 10 for mutants. Statistical significance was determined using the Student’s t-test. ****p < 0.0001. β-Actin was used as the internal control. WT, wild-type; MU, lrpap1 homozygous mutant. hpf, hours post-fertilization; 2 m, two months; 3 m, three months EXPRESSION / LABELING:
PHENOTYPE:
|
|
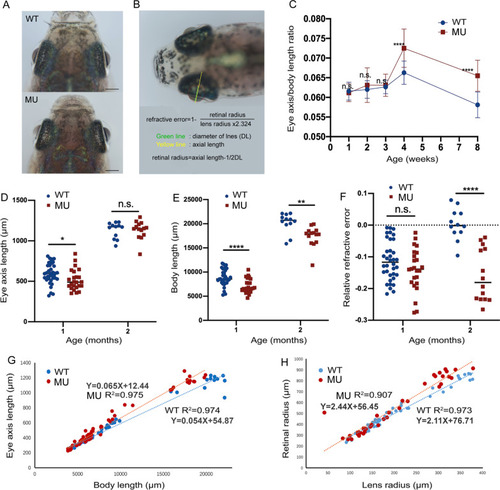
Longitudinal measurements of the eye dimensions using in vivo imaging. A Eye globes of wild-type and lrpap1 mutant zebrafish at three months. The scale bars refer to 500 μm. B The different ocular parameters measured and the method of calculation of the relative refractive error (RRE) used. C The eye axis to body length ratio was determined at different time points. The eye axis length (D) and body length (E) of one- and two-month-old wild-type and mutant zebrafish were also determined individually. F RRE measurements in one- and two-month-old mutant and wild-type zebrafish. G Correlation analysis of the eye axis length and body length measurements. H Correlation analysis of the retinal radius and lens radius measurements. WT, wild-type. MU, lrpap1 homozygous mutant. Statistical significance was determined using the Student’s t-test: n.s. = no significance; *p < 0.05; **p < 0.01; ***p < 0.001; ****p < 0.0001. For wild-type zebrafish, n = 16, 13, 12, 36, and 12 eyes one week, two weeks, three weeks, one month, and two months post-fertilization, respectively. For the lrpap1 mutant line, n = 12, 10, 13, 24, and 14 eyes one week, two weeks, three weeks, one month, and two months post-fertilization, respectively PHENOTYPE:
|
|
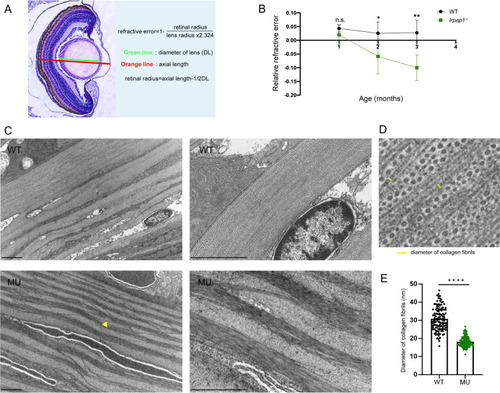
Histological analysis via hematoxylin–eosin (HE) staining and ultrastructural analysis using transmission electron microscopy (TEM). A The method used to calculate the relative refractive error (RRE). Refractive error = 1-retinal radius/ (lens radius × 2.324). B RRE quantitative data. N = 8 and 14 eyes for 1-month-old wild-type and mutant zebrafish, respectively; n = 18 and 17 eyes for 2-month-old wild-type and mutant zebrafish, respectively; n = 10 and 21 eyes for 3-month-old wild-type and mutant zebrafish, respectively. C Electron micrographs of 3-month old zebrafish from the two groups. The yellow triangle points to disordered collagen fibers. The scale bars refer to 2 μm. D Schematic diagram of collagen fiber diameter measurement. E Quantification of the diameter of the collagen fibers; 120 fibers per group were analyzed. WT, wild-type. MU, lrpap1 homozygous mutant. Statistical significance was determined using the Student’s t-test: n.s. = no significance; *p < 0.05; **p < 0.01; ***p < 0.001; ****p < 0.0001 PHENOTYPE:
|
|
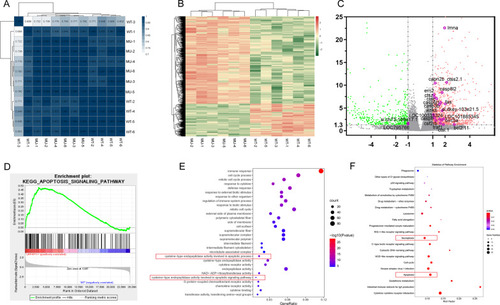
Results of RNA sequencing and bioinformatics analysis. A Correlation matrix. The darker the blue, the higher the correlation coefficient. B Heat map showing differentially expressed genes in the eyes of lrpap1 mutant versus wild-type zebrafish. The log10 (TPM expression levels + 1) value is color-coded. C Volcano plot analysis of differentially expressed genes in lrpap1-deficient versus wild-type animals at three months post-fertilization. The abscissa represents the change in gene expression multiple in different samples, and the ordinate represents the statistical significance of the change of gene expression. The orange dots represent 91 genes significantly up-regulated in the mutant group, and the green dots represent 247 down-regulated genes. The purple circles show 22 genes associated with apoptosis factors. D GSEA analysis in the context of apoptosis pathway gene sets (NES = 1.642, p value = 0.010). E, F GO and KEGG analysis of the differentially expressed (|log2(Fold Change)|> 1 and Q value < 0.05). Apoptotic-related pathways are highlighted with red boxes. WT, wild-type. MU, lrpap1 homozygous mutant |
|
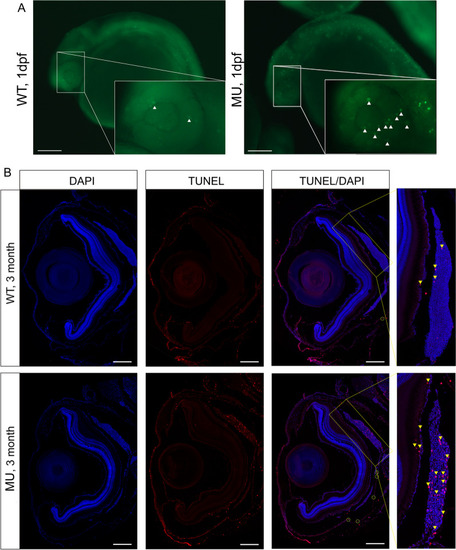
Knockout of lrpap1 in zebrafish leads to increased apoptosis in the eye. (A) AO was used to quantify apoptosis in the eyes of 24 hpf embryos: green fluorescence, as highlighted using white triangles. (B) TUNEL staining was also used to investigate ocular apoptosis in adult zebrafish. Apoptosis is highlighted by yellow triangles, particularly in the choroidal tissue (magnified image). The green circles highlight apoptotic cells in the sclera. The scale bars refer to 200 μm. WT, wild-type. MU, lrpap1 homozygous mutant. dpf, days post-fertilization PHENOTYPE:
|
|
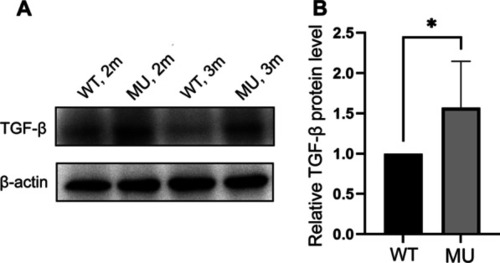
Lrpap1 deficiency is associated with the up-regulation of TGF-β. (A) Western blot analysis of TGF-β in the eyes of lrpap1 mutants and wild-type zebrafish two months and three months post-fertilization. (B) Relative quantitative result of TGF-β protein. n = 8 for wild-type zebrafish and n = 8 for mutants. Statistical significance was determined using the Student’s t-test. *p < 0.05. β-Actin was used as the internal control. WT, wild-type; MU, lrpap1 homozygous mutant; 2 m, two months; 3 m, three months EXPRESSION / LABELING:
PHENOTYPE:
|
|
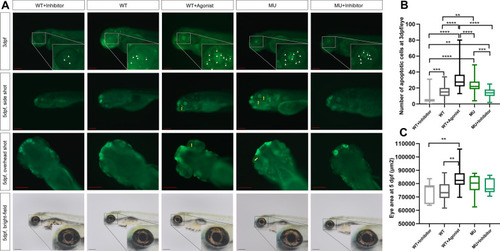
TGF-β promotes apoptosis in the eyes of zebrafish embryos during development. A As shown by the white triangles and yellow arrows, the bright green fluorescence from AO staining indicates the apoptosis in eyeballs in each group at 3 dpf and 5 dpf, respectively. The bright-field picture shows the side view of each group of embryos in which the eyeball is magnified in equal proportion. The scale bars refer to 200 μm. B Number of apoptotic cells at 3 dpf per eye from AO staining (n = 26, 54, 54, 45, and 39 from left to right). C Lateral area of the eyeball in each group (n = 11, 20, 21, 20, and 16 from left to right). *p < 0.05; **p < 0.01; ***p < 0.001; ****p < 0.0001. β-Actin was used as the internal control. WT, wild-type. MU, lrpap1 homozygous mutant. dpf, days post-fertilization. 2 m, two months. 3 m, three months PHENOTYPE:
|

