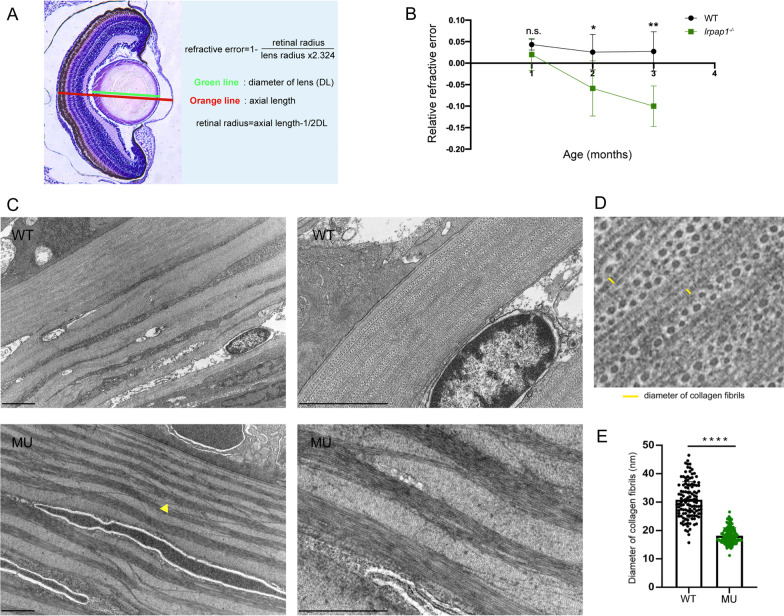
Fig. 3
Histological analysis via hematoxylin–eosin (HE) staining and ultrastructural analysis using transmission electron microscopy (TEM). A The method used to calculate the relative refractive error (RRE). Refractive error = 1-retinal radius/ (lens radius × 2.324). B RRE quantitative data. N = 8 and 14 eyes for 1-month-old wild-type and mutant zebrafish, respectively; n = 18 and 17 eyes for 2-month-old wild-type and mutant zebrafish, respectively; n = 10 and 21 eyes for 3-month-old wild-type and mutant zebrafish, respectively. C Electron micrographs of 3-month old zebrafish from the two groups. The yellow triangle points to disordered collagen fibers. The scale bars refer to 2 μm. D Schematic diagram of collagen fiber diameter measurement. E Quantification of the diameter of the collagen fibers; 120 fibers per group were analyzed. WT, wild-type. MU, lrpap1 homozygous mutant. Statistical significance was determined using the Student’s t-test: n.s. = no significance; *p < 0.05; **p < 0.01; ***p < 0.001; ****p < 0.0001

