
- Title
-
A cerebellar-prepontine circuit for tonic immobility triggered by an inescapable threat
- Authors
- Bhandiwad, A.A., Chu, N.C., Semenova, S.A., Holmes, G.A., Burgess, H.A.
- Source
- Full text @ Sci Adv

Repeated vibratory stimuli evoke tonic immobility in larval zebrafish.
(A) Left: Schematic of the apparatus used to evoke behavioral arrest. Right, top: Locomotion traces from a single fish during baseline and post-stimulus phases. Color represents speed in each epoch. Right, bottom: Fish positions during 10-s epochs of baseline (A and B), arrest (C and D), and recovery (E and F) phases; saturation indicates time within epoch. (B) Raster plot of speed (mm/s; n = 51 fish). Rows: speed normalized to mean baseline. (C) Mean normalized speed after 15-s arrest-inducing stimuli of 0 dB (no stimulus), 14 dB, 20 dB, and 26 dB re. 1 m/s2 (n = 27 fish). Shaded area: SEM. (D) Speed change in first epoch (mm/s) compared to baseline at 0 dB (control), 14 dB, 20 dB, and 26 dB re. 1 m/s2 (n = 27 fish). Dunnett’s test **P < 0.01, ***P < 0.001. (E) Swim initiation frequency and displacement per swim for turns (blue) and forward swims (magenta). Top: Examples of turns and forward swims. Middle: Changes in initiation frequency (left) and displacement for each bout (right) during baseline and arrest (n = 16). Bottom: Effect sizes (Cohen’s d) for change in responsiveness, mean ± 95% confidence interval (CI). (F) Left: Righting reflex (n = 10 groups with five fish per group) under control (gray) and arrest (red) conditions. Shaded area: SEM. (G) Estimation plot for time to return to balance under control (gray) and arrest (red) conditions. (H) Left: Schematic of acoustic and dark flash stimuli. Right: Changes in acoustic short-latency startle (n = 27 fish, interstimulus interval = 30 s) and dark flash–evoked O-bend responses (n = 27 fish, interstimulus interval = 60 s) during arrest (means ± SEM). **P < 0.01, ***P < 0.001, Paired-sample t test. |

A circuit-breaking screen for behavioral arrest.
(A) Schematic for the circuit-breaking screen using 31 enhancer-trap Gal4 lines. (B) Dorsal and sagittal maximum projection of Gal4 patterns in three lines, y318-Gal4 (left), y334-Gal4 (middle), and y405-Gal4 (right), which showed disruption of arrest following stimulation. Projections are depth-coded, D, dorsal; V, ventral. Gray counterlabel: HuC:Cerulean. (C) Change in locomotion after intense vibration for lines shown in (B) for ablated larvae (red) and intact sibling controls (gray). y318-Gal4 (n = 23 control/26 ablated), y334-Gal4 (n = 21/24), y405-Gal4 (n = 18/12). Effect sizes are Cohen’s d. **P < 0.01, ***P < 0.001, independent samples t test. |
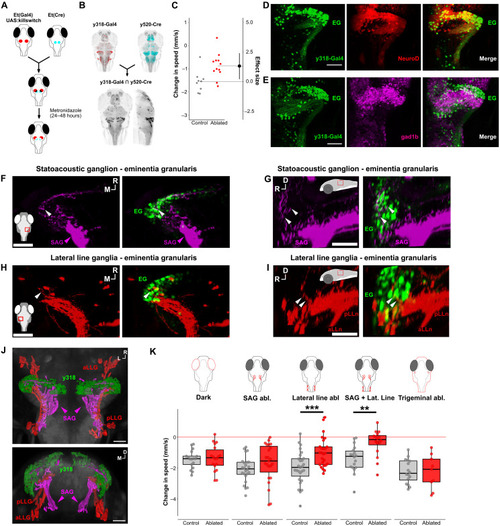
Acoustic and lateral line inputs converge onto lateral cerebellar granule cells to drive arrest.
(A) Schematic of intersectional ablation strategy to parse y318-Gal4 expression. (B) Maximum projections of y318-Gal4 (red) and y520-Cre (cyan) expression patterns. Bottom: Dorsal and sagittal views of neurons labeled by NTR in y318-Gal4/y520-Cre intersect (mean from n = 3 fish). (C) Swim speed change (mm/s) after stimulus in y318-Gal4/y520-Cre–ablated fish (red, n = 12) and sibling controls (gray, n = 9). Effect size is Cohen’s d. t test P = 0.01. (D) Confocal slice of cerebellum showing y318-Gal4;UAS:kaede (green) and NeuroD-eGFP (red), which labels cerebellar granule cells. Scale bar, 50 μm. (E) Confocal slice of cerebellum showing y318-Gal4;UAS:kaede (green) and gad1b:RFP (magenta; GABAergic neurons). Scale bar, 50 μm. (F and G) Confocal slice of y256-Gal4;UAS:eGFP-CAAX–labeled neurons (magenta) from SAG (magenta arrowhead) coregistered with y318-Gal4;UAS:kaede (green). White arrowhead: neurite termination of y256-Gal4 neurons. Inset: imaged area. Scale bar, 30 μm. (H and I) Confocal slice of y397-Gal4;UAS:eGFP-CAAX–labeled neurons from the anterior and posterior lateral line ganglia (red) coregistered with y318-Gal4;UAS:kaede (green). White arrow: y397-Gal4 neuron termination. Scale bar, 30 μm. (J) 3D reconstruction of SAG neurons from (F) and (G) (magenta), aLLG and pLLG neurons (red) from (H) and (I), and y318-Gal4;UAS:kaede (green). Scale bar, 50 μm. (K) Effects of removing visual (dark; n = 17 control, n = 18 dark), auditory (SAG Abl; n = 23 control, n = 24 ablated), lateral line (lateral line abl; n = 27 control, n = 26 ablated), combined SAG and lateral line (n = 18 control, n = 16 ablated), and somatosensory cues (Trigeminal abl; n = 16 control, n = 9 ablated) on arrest. t test, **P < 0.01, ***P < 0.001. Abbreviations: aLLn, anterior lateral line; EG, eminentia granularis; pLLn, posterior lateral line; SAG, statoacoustic ganglion; D, dorsal; R, rostral; M, medial; L, lateral. |

Neuropeptide-rich neurons in the prepontine tegmentum are required for behavioral arrest.
(A) Dorsal and sagittal views of computationally predicted overlap between y334-Gal4 and y405-Gal4 (black pixels). vPPNs are outlined. HuC:Cerulean counterlabel in gray. (B) Confocal images from y405-Gal4 after sham ablation or bilateral vPPN multiphoton ablation. Scale bar, 40 μm. (C) Swim speed change after intense vibration in control (gray, n = 20) and y405-Gal4 vPPN–ablated (red, n = 10) larvae. Effect size is Cohen’s d. t test, P < 0.001. (D) Top: Confocal section of y405-Gal4;UAS:kaede (cyan) and vglut:GFP (glutamatergic neurons, red). Scale bar, 25 μm. Bottom: Overlay of y405-Gal4 (cyan) with gad1b:RFP (left), vmat2:GFP (middle), and vachta:GFP (right) neurons. Inset: imaging window. Scale bar, 25 μm. (E) Schematic 3D reconstruction of cell clusters in the prepontine tegmentum based on imaging y405-Gal4 vPPNs (white), noradrenergic locus coeruleus neurons (LC, vmat2:GFP, yellow), cholinergic neurons of the nucleus of the isthmus (NI, vachta:GFP, magenta), and GABAergic neurons (gad1b:RFP, red). Midbrain-hindbrain boundary (MB/HB, dotted line). (F) Procedure for manual isolation of vPPNs for transcriptomic analysis. (G) Maximum projection of y334-Gal4 (blue) and y405-Gal4 (orange) expression in vPPNs. Scale bar, 40 μm. (H and I) Enrichment of genes expressed in y334-Gal4 (H) and y405-Gal4 (I) relative to a pan-neuronal reference. Labeled genes (red) show log2 fold changes >8 and false discovery rate–corrected P values < 0.05. Dashed red line: Benjamini-Hochberg corrected 5% false discovery rate. (J) Top: crhb mRNA (red) labeled using hybridization chain reaction (HCR) with y405-Gal4;UAS:kaede (cyan). Arrowheads show example neurons that are colabeled by kaede and crhb. Scale bar, 30 μm. Bottom: calca mRNA (red) labeled using HCR with y405-Gal4;UAS:kaede (cyan). Arrowheads show example neurons that are colabeled by kaede and calca. Scale bar, 30 μm. |

GABAergic signaling to vPPNs regulates arrest onset.
(A) Dorsal (left) and sagittal (right) views of coregistered images of Purkinje cells (PC, aldoca:Gal4;UAS:eGFP-CAAX, cyan) and y334-Gal4 vPPNs (dashed white line). Projections from PCs toward vPPNs (white arrowheads) and to hindbrain (yellow arrowheads). Scale bar, 50 μm. (B) Dorsal (top) and sagittal (bottom) confocal slices from y405-Gal4, UAS:kaede (red), and UAS:gphn-FingR-mCherry (cyan) transgenic larvae. Arrowheads show postsynaptic gephyrin puncta. Inset shows imaging window. Scale bar, 30 μm. (C) Dorsal (top) and sagittal (bottom) views of 3D reconstructions of eurydendroid cell projections (EC; gray) coregistered with y334-Gal4 vPPNs (red). Scale bar, 100 μm. (D) Top: Schematic diagram of ethanol exposure experiment. Bottom, left: Change in swim speed (mm/s) after vibratory stimulus compared to average baseline in control (gray, n = 18) and 300 mM ethanol exposed (red, n = 18) shown as change in speed following vibrational stimuli. Effect size is Cohen’s d. t test, P < 0.001. Bottom, right: Change in swim speed (mm/s) in control (gray, n = 18) and ethanol washout (blue, n = 18) fish. Effect size is Cohen’s d. t test, P = 0.72. (E) Change in swim speed (mm/s) after bath application of GABA (n = 27 larvae per group). Top row shows raw change in speed and bottom row shows 95% CI of mean differences relative to control. ANOVA, P = 0.01. (F) GABAA receptor complex and ICL of γ subunit. (G) Left: Changes in swim speed (mm/s) following vibratory stimuli in y334-Gal4;UAS:ICL-GFP (ICL, red, n = 47) and sibling controls (gray, n = 61). t test, P = 0.007. Right: Changes in swim speed (mm/s) following vibratory stimuli in y334-Gal4;UAS:ICLmut-GFP (ICLmut, red, n = 40) and sibling controls (gray, n = 47). t test, P = 0.91. |

vPPN activation correlates with arrest induced by intense stimuli.
(A) Dorsal plane from registered, averaged pERK/tERK ratios in control (n = 12 fish, left) and vibration-exposed fish (n = 12, right). Color shows p/tERK ratio (AU). Bottom: Magnified region around right vPPN. Scale bar, 30 μm. (B) pERK/tERK ratios in vPPN masked regions for control (gray, n = 12) and vibration stimulus-exposed (red, n = 12) conditions. ANOVA F1,22 = 92.98, P < 0.001. (C) Apparatus used to deliver pulsed water jets at head-fixed zebrafish during calcium imaging. (D) Top: Activity in flow-responsive (n = 41 neurons from 14 fish) and nonresponsive (n = 379 cells) neurons. GCaMP6s fluorescence normalized to coexpressed nuclear-localized red fluorescent protein (RFP; ΔR/R). Vertical lines show flow stimulation period. Bottom: Average ± SEM normalized GCaMP6s fluorescence for responsive (red) and nonresponsive (black) neurons. (E) Location of responsive (red) and nonresponsive (gray) neurons within the vPPN. (F) Change in speed relative to baseline (mm/s) in sibling controls (gray, n = 23 fish) and y334-Gal4, UAS:CoChR-tdTomato (red, n = 22 fish) following 15 s, 60 Hz (50% duty cycle) photostimulation. Effect size is Cohen’s d. ANOVA F1,45 = 8.196, P = 0.006. |
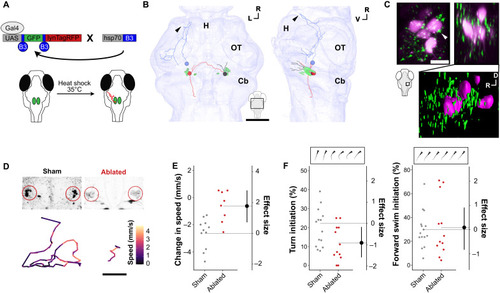
vPPN drive arrest via RoL1 premotor neurons.
(A) Schematic of intersectional method for sparse labeling of single neurons with membrane-tagged RFP (lynTagRFP) to enable morphological reconstruction. (B) Reconstructed y334-Gal4 vPPNs and RoL1 neurons (green) vPPNs project to ipsilateral (black), contralateral (red), and hypothalamic (blue) targets. Arrowhead: terminal projection in rostral hypothalamus. All neurons can be viewed in fig. S7. Scale bar, 50 μm. H, hypothalamus; OT, optic tectum; Cb, cerebellum. (C) Top: Maximum projection of y334-Gal4;UAS:synaptophysin-RFP (green) and backfilled RoL1 (magenta) colocalization in dorsal (left) and lateral (right) views. White arrowhead: apposition of y334-Gal4 synapses with RoL1 cell body. Scale bar, 10 μm. Bottom: 3D rendering of lateral view showing synapses relative to RoL1 and surrounding neuropil. (D) Top, left: Sham-ablated and (right) multiphoton-ablated RoL1 reticulospinal neurons. Bottom: Baseline movement traces for sham-ablated (left) and RoL1-ablated (right) fish. Color denotes speed within a 5-s epoch. Scale bar, 1 cm. (E) Change in speed (mm/s) after vibratory stimulus in sham-ablated (gray, n = 11 fish) and bilateral RoL1-ablated (red, n = 8 fish). Effect size is Cohen’s d. t test, P = 0.001. (F) Turn initiation (left) and forward swim initiation. t test, P = 0.03. Right: Frequency during baseline locomotion in sham-ablated (gray, n = 14) and RoL1-ablated (red, n = 12) fish. Insets show examples of turn and forward swim bouts. |

Circuit model for tonic immobility.
(A) Defense cascade behaviors represented in terms of relative movement with respect to perceived threat. (B) Repeated, inescapable stimuli activate peripheral auditory (SAG) and lateral line ganglia, which then excite the granule cells of the cerebellum (green lines). During stimulus presentation, the cerebellum sends inhibitory projections to the prepontine neurons (vPPNs) and eurydendroid cells (ECs), which may project to vPPNs (dashed lines). Following sustained vibratory stimulation, cerebellar inhibition ceases and leads to activation of the vPPNs. Bilateral activation of the vPPNs disrupts RoL1 neuron activity, leading to suppressed turning behavior and immobility. |