
Fig. 1.
- ID
- ZDB-IMAGE-221018-10
- Publication
- Bhandiwad et al., 2022 - A cerebellar-prepontine circuit for tonic immobility triggered by an inescapable threat
- All Figures
- Figures for Bhandiwad et al., 2022
|
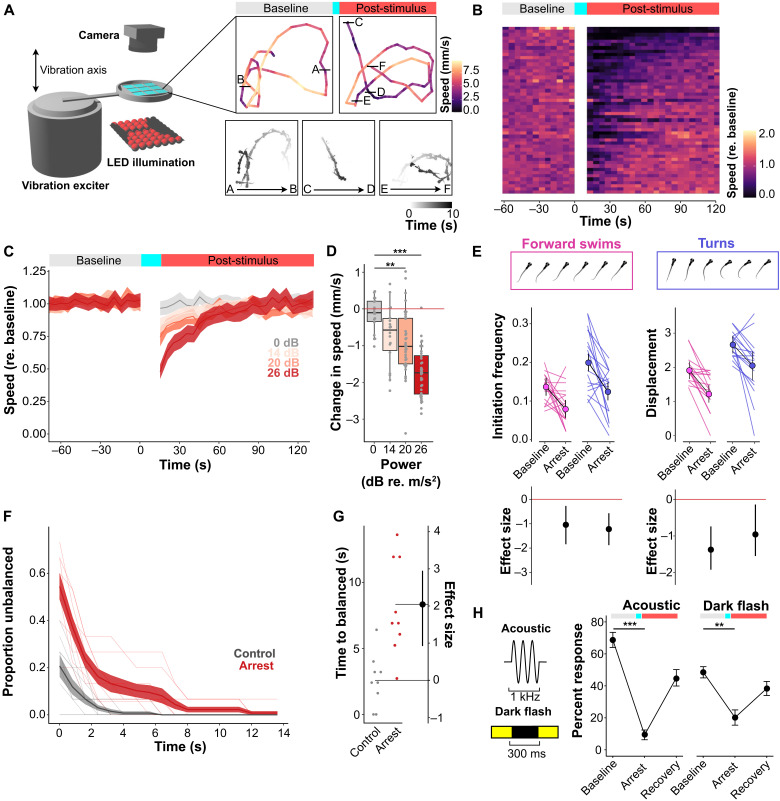
Fig. 1.
(A) Left: Schematic of the apparatus used to evoke behavioral arrest. Right, top: Locomotion traces from a single fish during baseline and post-stimulus phases. Color represents speed in each epoch. Right, bottom: Fish positions during 10-s epochs of baseline (A and B), arrest (C and D), and recovery (E and F) phases; saturation indicates time within epoch. (B) Raster plot of speed (mm/s; n = 51 fish). Rows: speed normalized to mean baseline. (C) Mean normalized speed after 15-s arrest-inducing stimuli of 0 dB (no stimulus), 14 dB, 20 dB, and 26 dB re. 1 m/s2 (n = 27 fish). Shaded area: SEM. (D) Speed change in first epoch (mm/s) compared to baseline at 0 dB (control), 14 dB, 20 dB, and 26 dB re. 1 m/s2 (n = 27 fish). Dunnett’s test **P < 0.01, ***P < 0.001. (E) Swim initiation frequency and displacement per swim for turns (blue) and forward swims (magenta). Top: Examples of turns and forward swims. Middle: Changes in initiation frequency (left) and displacement for each bout (right) during baseline and arrest (n = 16). Bottom: Effect sizes (Cohen’s d) for change in responsiveness, mean ± 95% confidence interval (CI). (F) Left: Righting reflex (n = 10 groups with five fish per group) under control (gray) and arrest (red) conditions. Shaded area: SEM. (G) Estimation plot for time to return to balance under control (gray) and arrest (red) conditions. (H) Left: Schematic of acoustic and dark flash stimuli. Right: Changes in acoustic short-latency startle (n = 27 fish, interstimulus interval = 30 s) and dark flash–evoked O-bend responses (n = 27 fish, interstimulus interval = 60 s) during arrest (means ± SEM). **P < 0.01, ***P < 0.001, Paired-sample t test.