
Fig. 4.
- ID
- ZDB-IMAGE-221018-14
- Publication
- Bhandiwad et al., 2022 - A cerebellar-prepontine circuit for tonic immobility triggered by an inescapable threat
- All Figures
- Figures for Bhandiwad et al., 2022
|
Fig. 4.
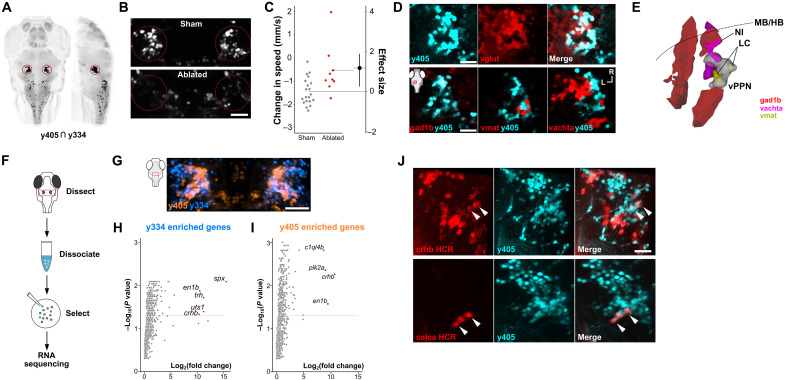
(A) Dorsal and sagittal views of computationally predicted overlap between y334-Gal4 and y405-Gal4 (black pixels). vPPNs are outlined. HuC:Cerulean counterlabel in gray. (B) Confocal images from y405-Gal4 after sham ablation or bilateral vPPN multiphoton ablation. Scale bar, 40 μm. (C) Swim speed change after intense vibration in control (gray, n = 20) and y405-Gal4 vPPN–ablated (red, n = 10) larvae. Effect size is Cohen’s d. t test, P < 0.001. (D) Top: Confocal section of y405-Gal4;UAS:kaede (cyan) and vglut:GFP (glutamatergic neurons, red). Scale bar, 25 μm. Bottom: Overlay of y405-Gal4 (cyan) with gad1b:RFP (left), vmat2:GFP (middle), and vachta:GFP (right) neurons. Inset: imaging window. Scale bar, 25 μm. (E) Schematic 3D reconstruction of cell clusters in the prepontine tegmentum based on imaging y405-Gal4 vPPNs (white), noradrenergic locus coeruleus neurons (LC, vmat2:GFP, yellow), cholinergic neurons of the nucleus of the isthmus (NI, vachta:GFP, magenta), and GABAergic neurons (gad1b:RFP, red). Midbrain-hindbrain boundary (MB/HB, dotted line). (F) Procedure for manual isolation of vPPNs for transcriptomic analysis. (G) Maximum projection of y334-Gal4 (blue) and y405-Gal4 (orange) expression in vPPNs. Scale bar, 40 μm. (H and I) Enrichment of genes expressed in y334-Gal4 (H) and y405-Gal4 (I) relative to a pan-neuronal reference. Labeled genes (red) show log2 fold changes >8 and false discovery rate–corrected P values < 0.05. Dashed red line: Benjamini-Hochberg corrected 5% false discovery rate. (J) Top: crhb mRNA (red) labeled using hybridization chain reaction (HCR) with y405-Gal4;UAS:kaede (cyan). Arrowheads show example neurons that are colabeled by kaede and crhb. Scale bar, 30 μm. Bottom: calca mRNA (red) labeled using HCR with y405-Gal4;UAS:kaede (cyan). Arrowheads show example neurons that are colabeled by kaede and calca. Scale bar, 30 μm.